

Metriplace & City OS
-
Product Designer
-
8 Weeks
1.0 Executive Summary & Vision
-
UX Design, Design System
"Smart City Operating System, Comprehensive UX/UI Design Scheme & Execution Strategy"
-
Figma, Gemini
-
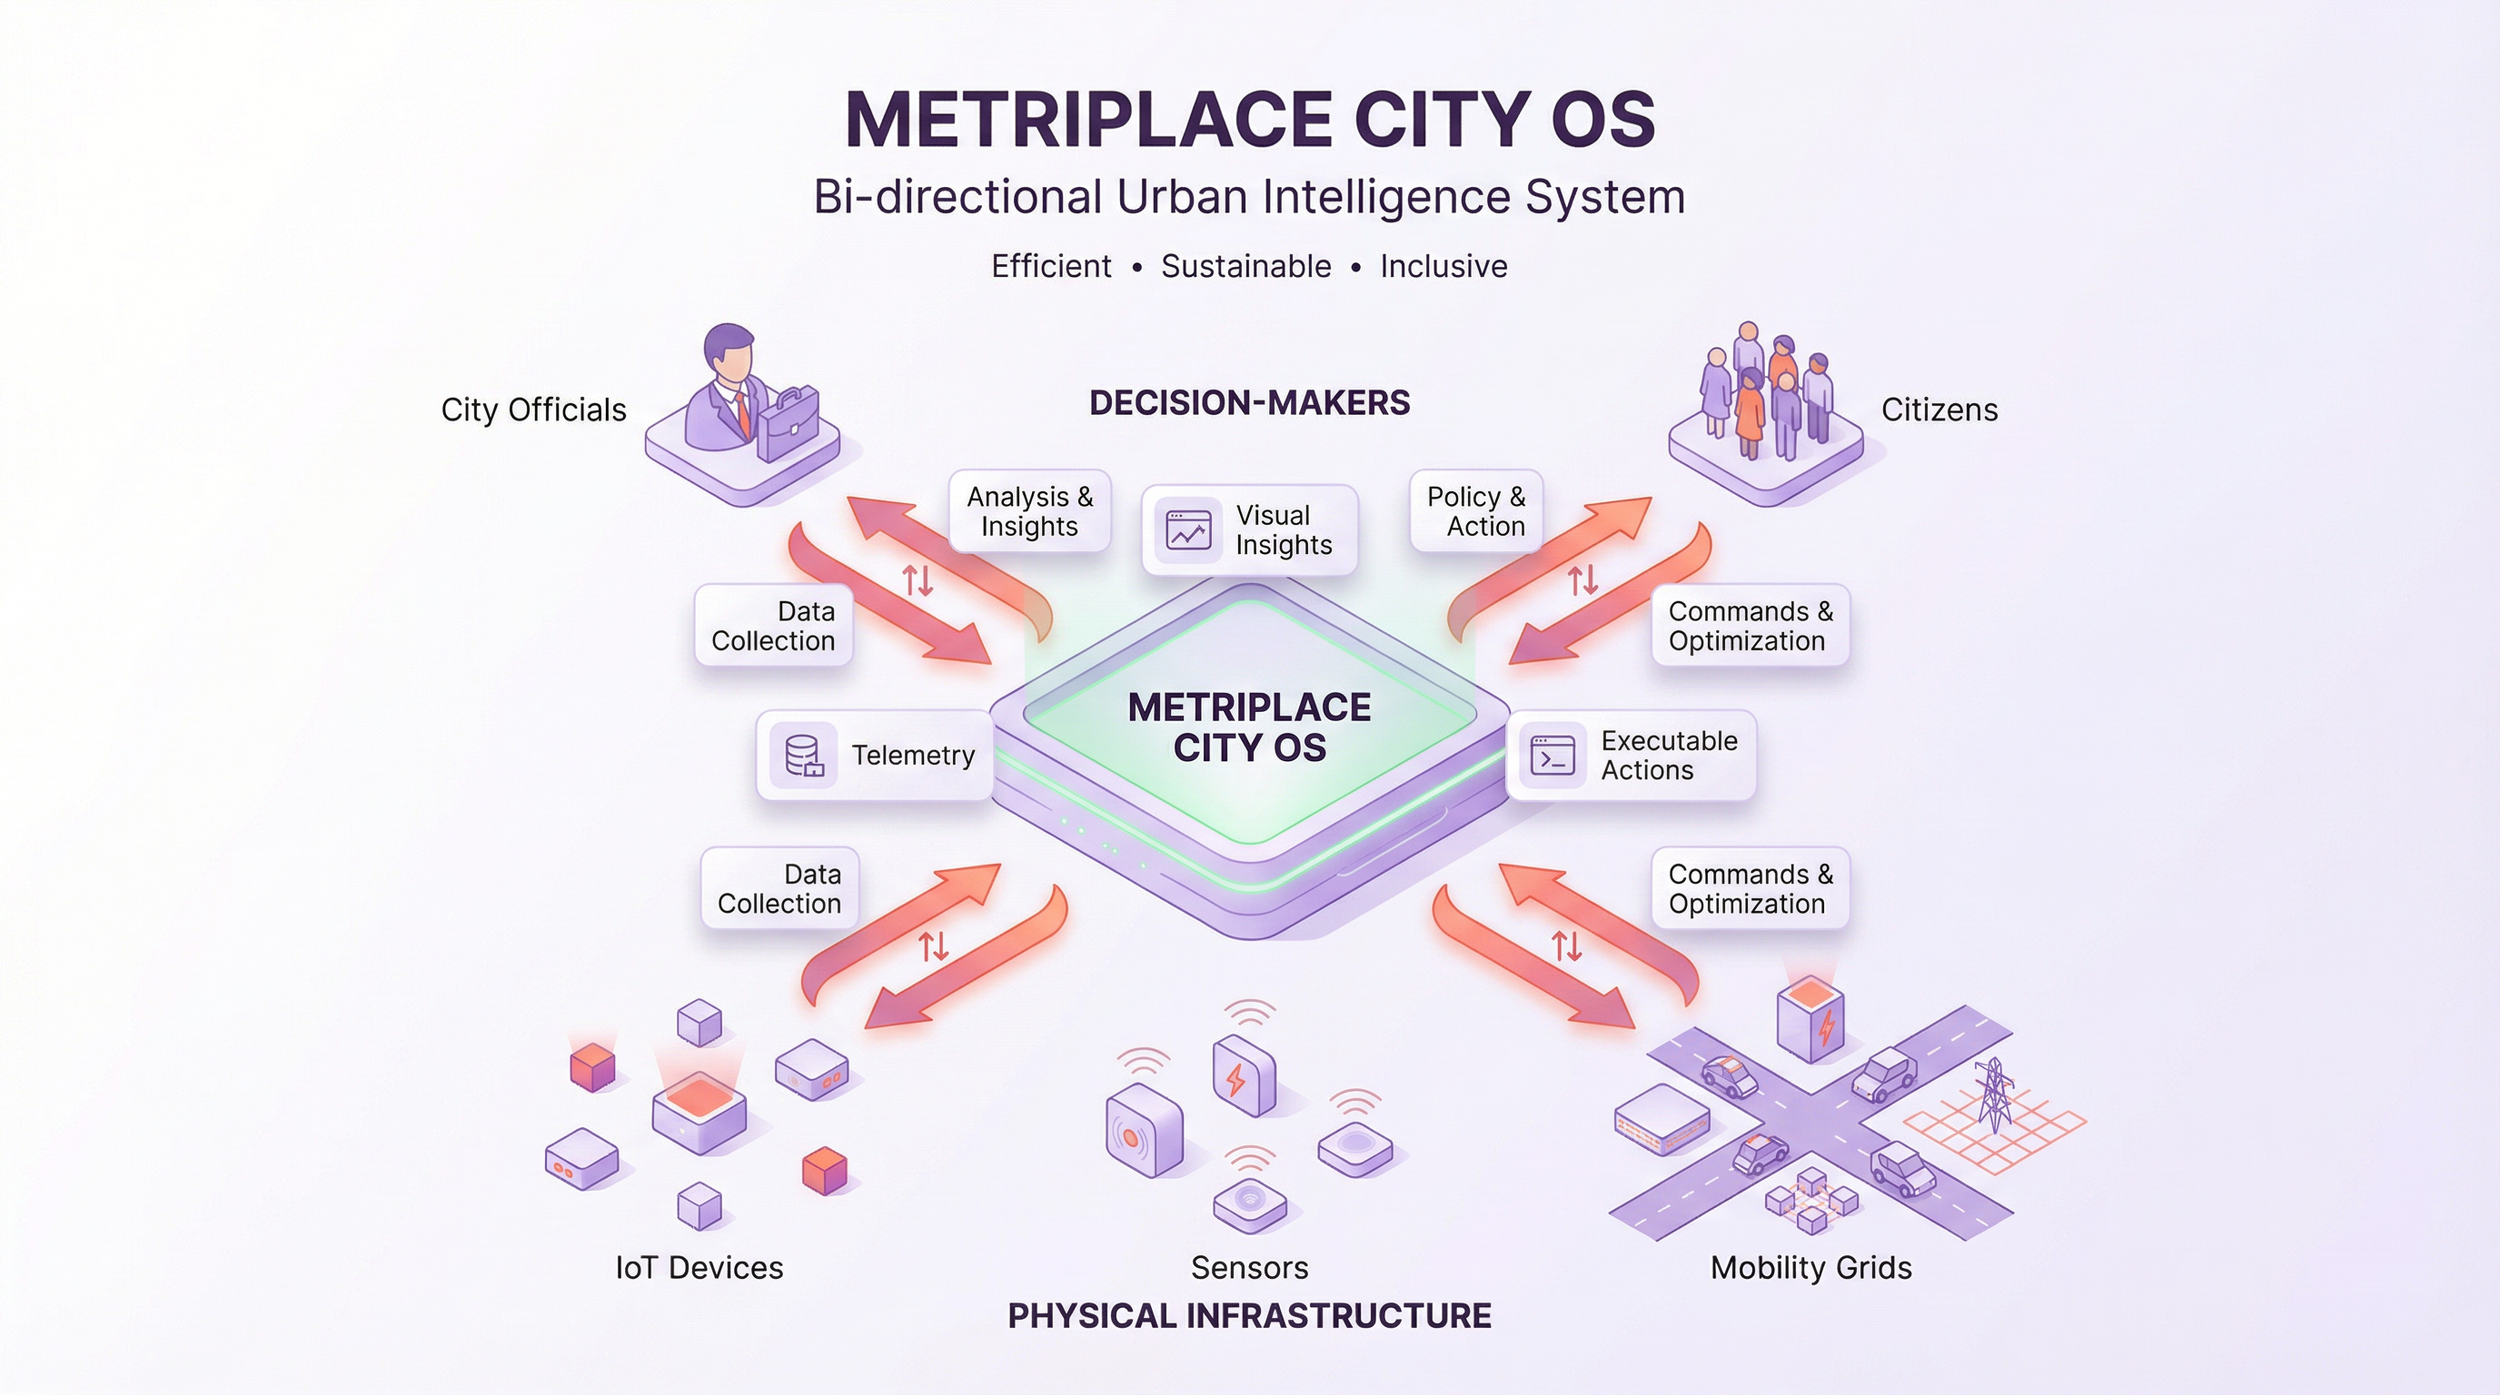
Metriplace is not just a data dashboard; it is a bi-directional City Operating System (City OS).
Downstream: Connects physical infrastructure (IoT, Sensors, Mobility Grids).
Upstream: Connects human decision-makers (City Officials) and urban residents (Citizens).
-
To transform massive, complex urban Telemetry into visual Insights and executable Actions, ultimately fostering a city that is efficient, sustainable, and inclusive.
2.0 UX Strategy Framework
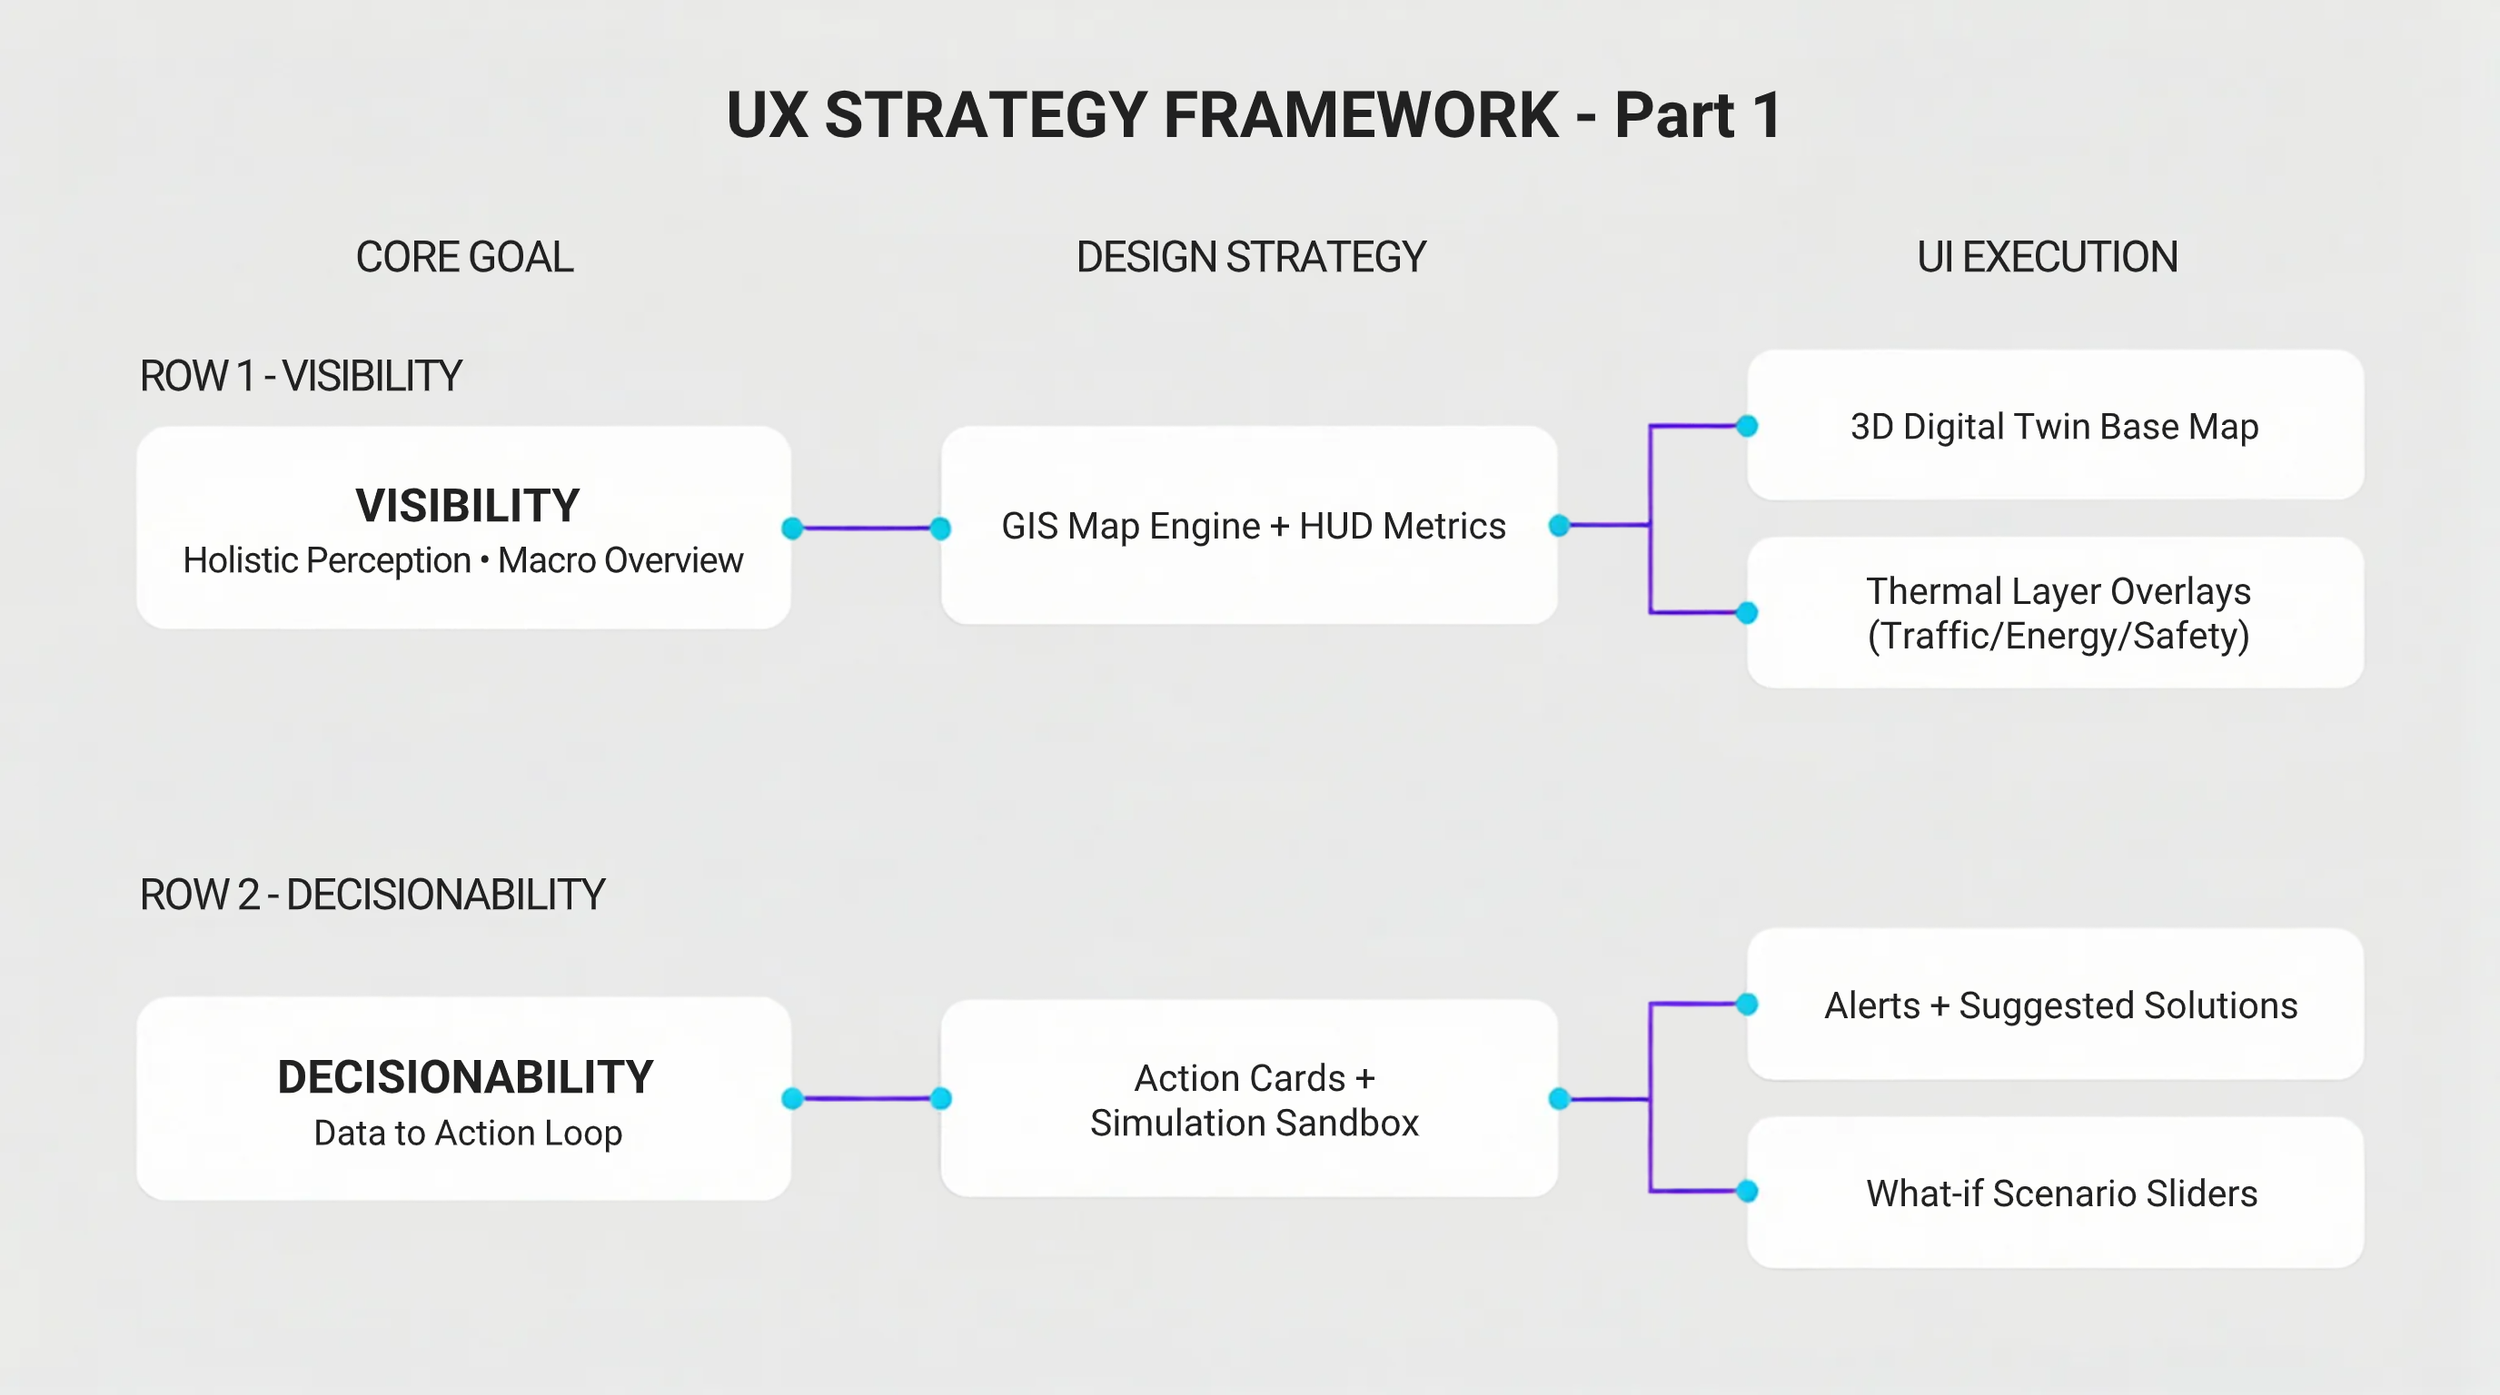
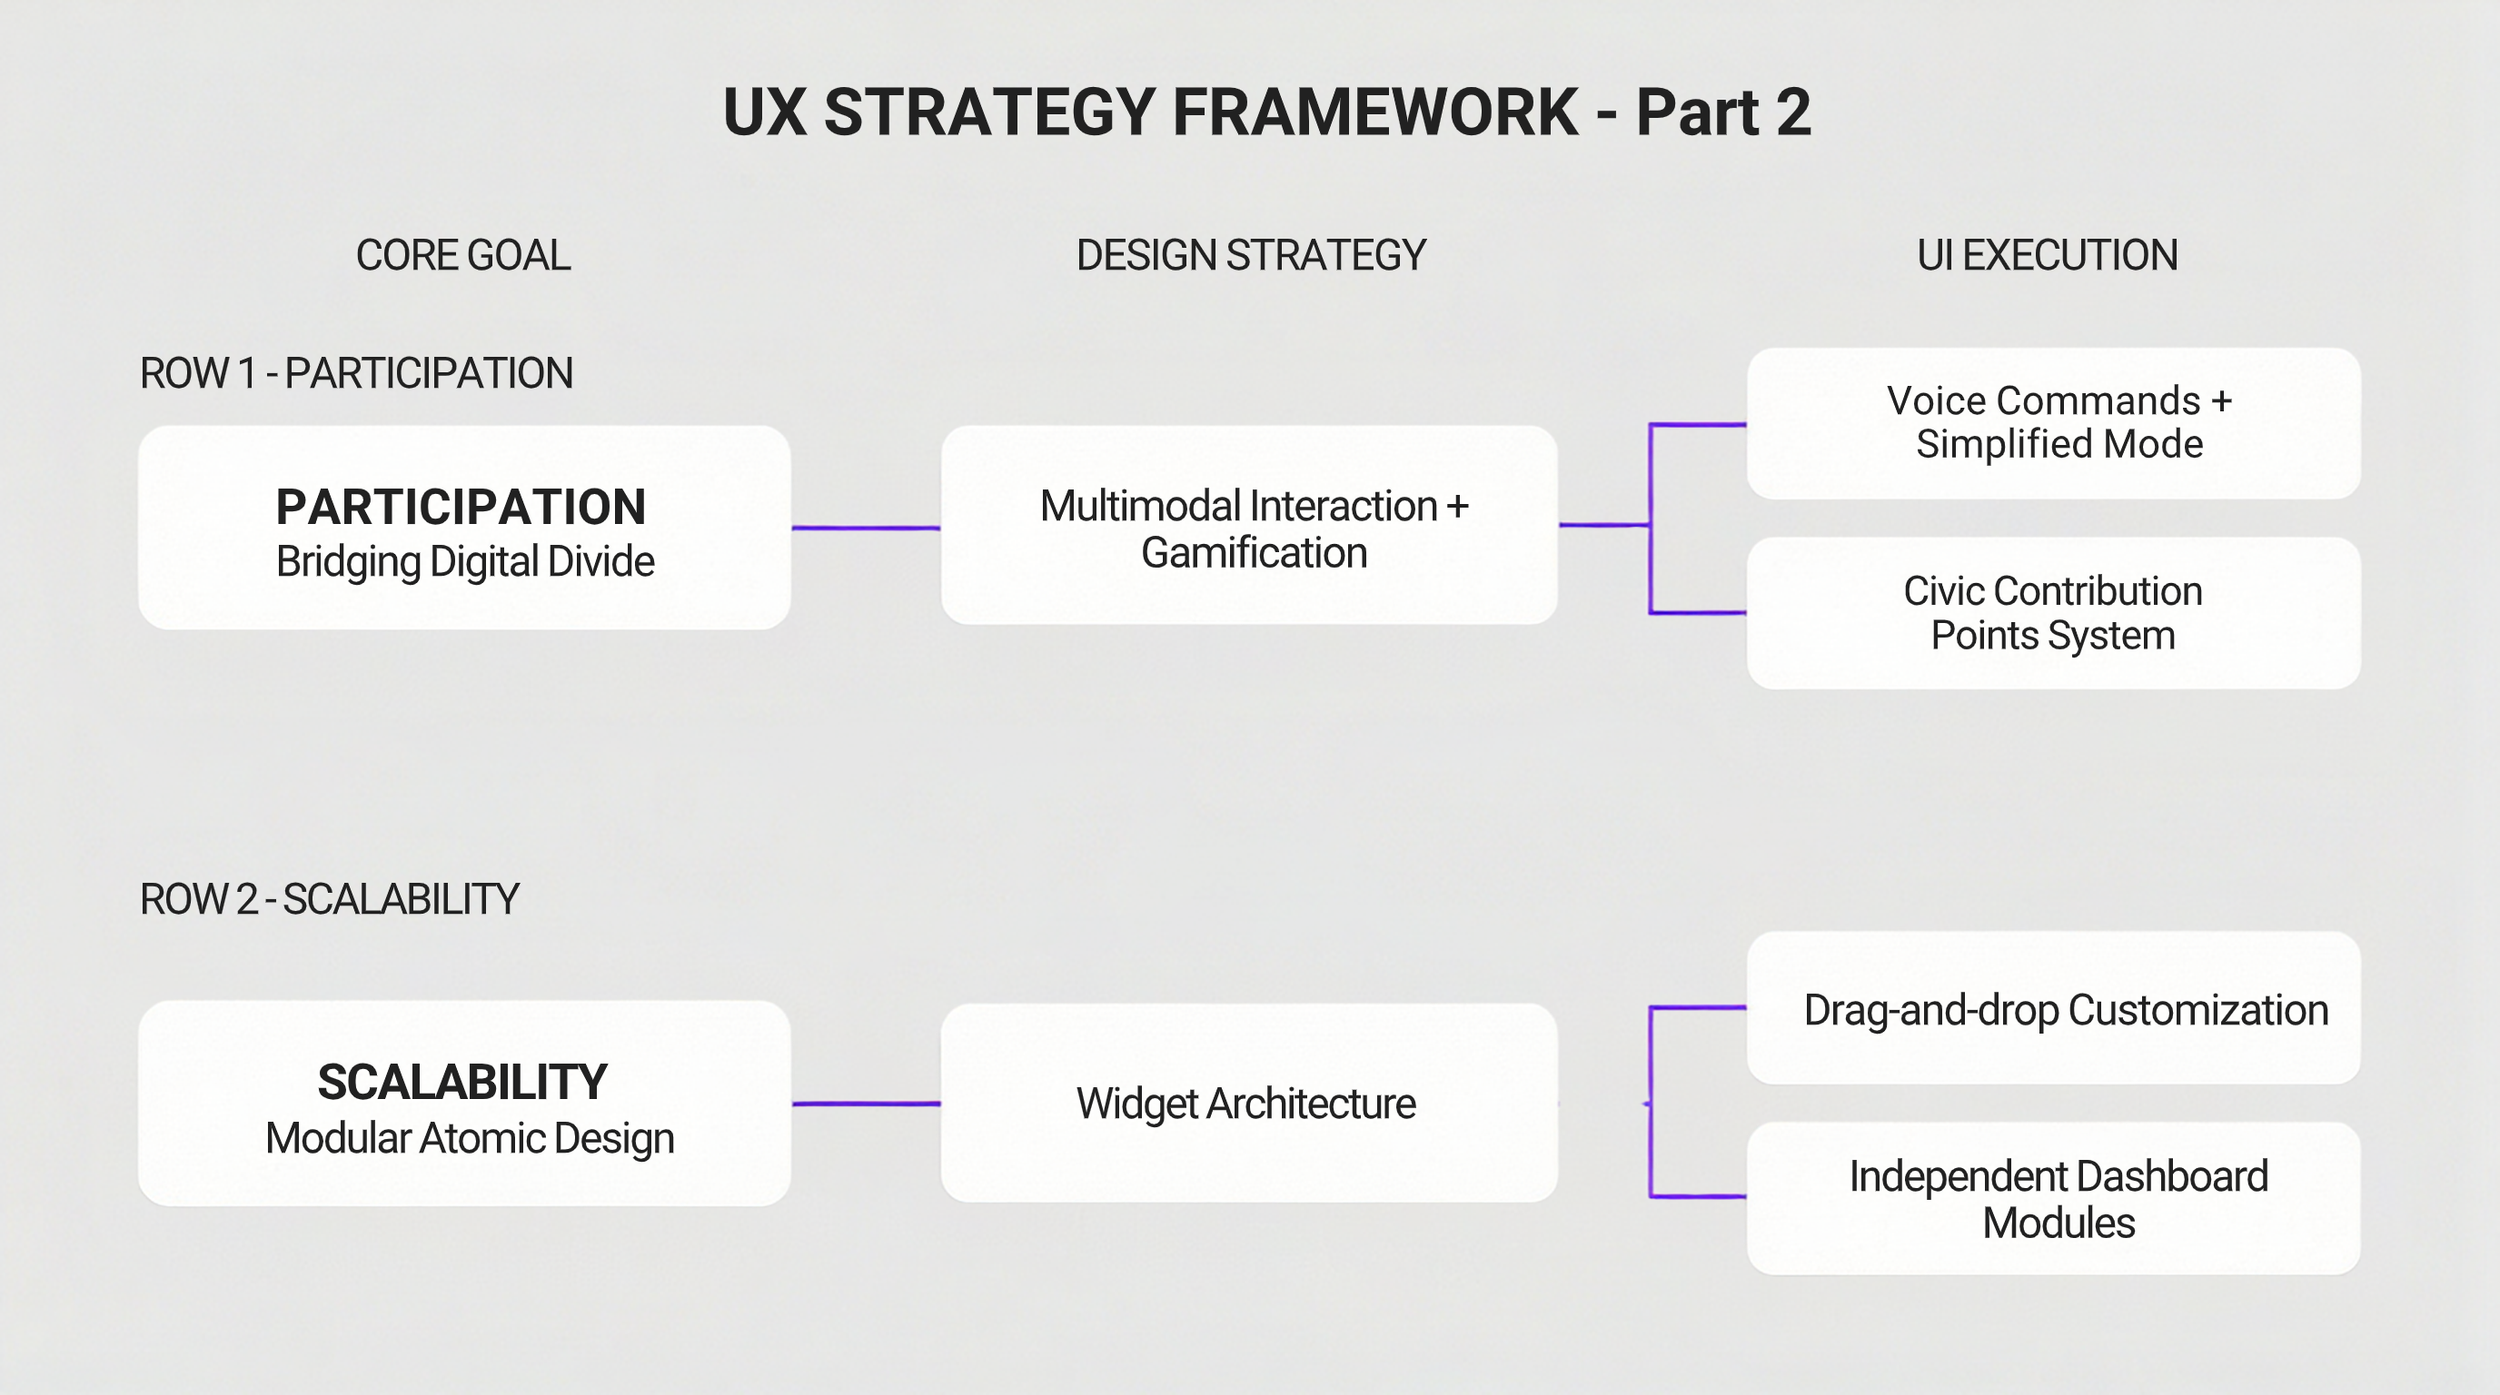
Based on the core goals identified in the research phase, we have defined specific execution strategies:
3.0 Key Personas & Pain Points
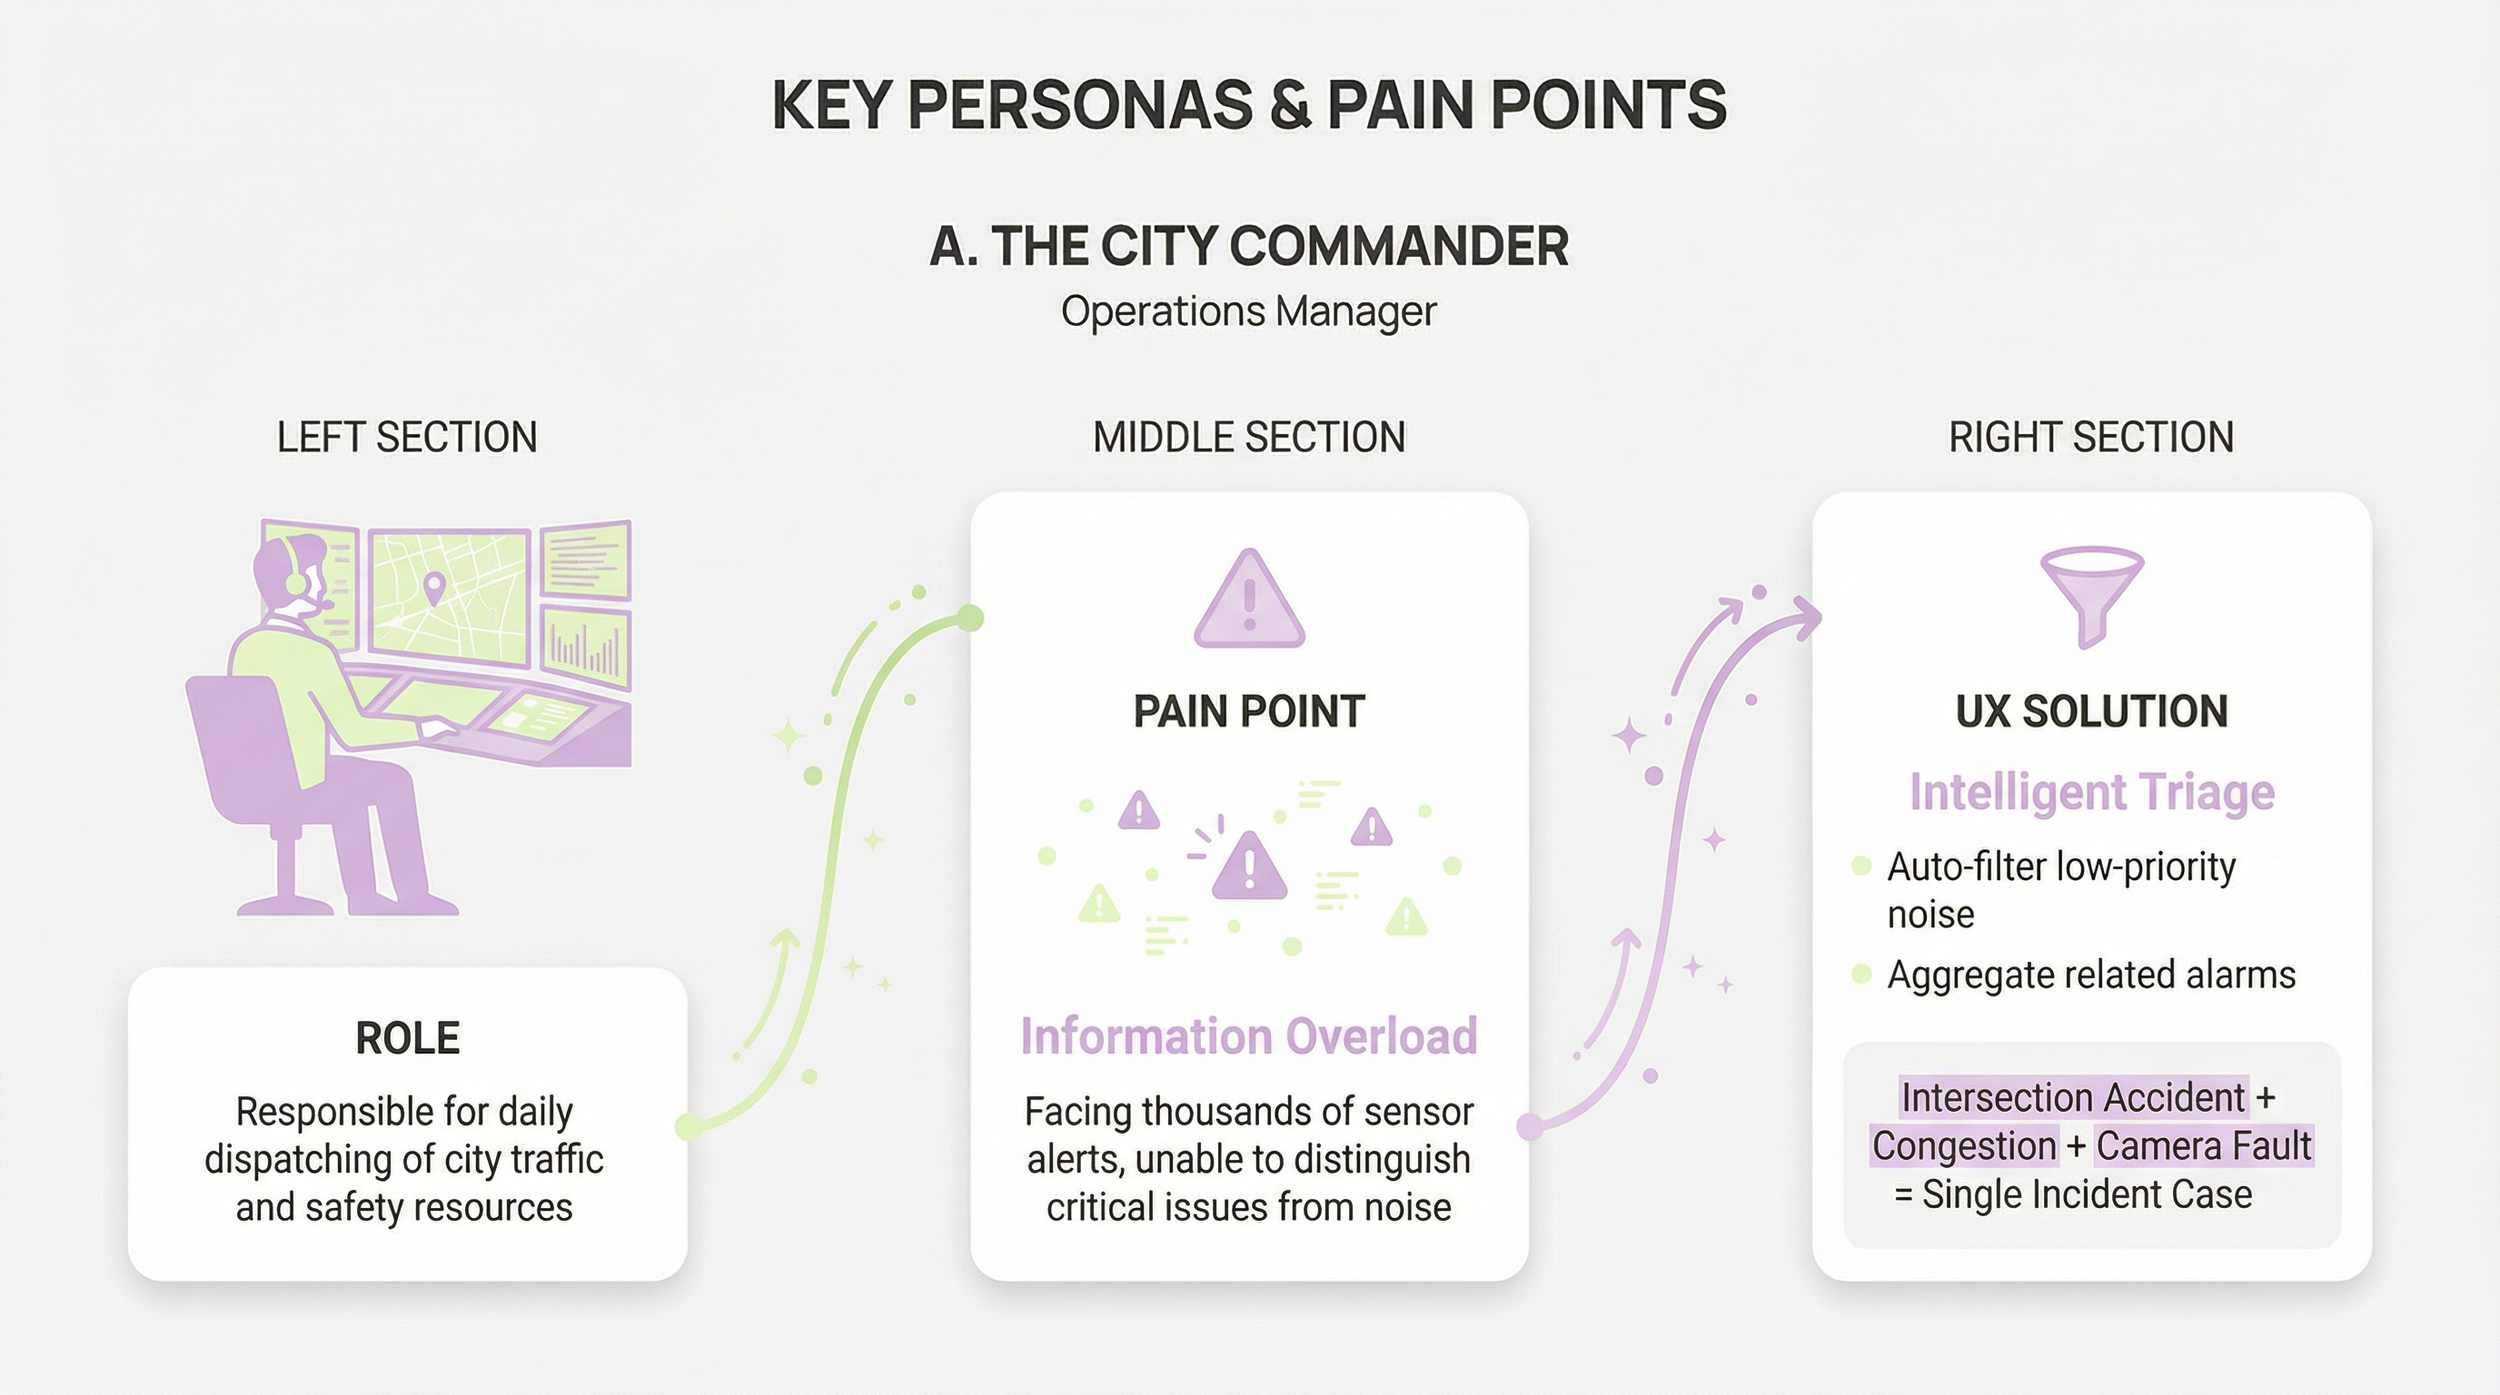
A. The City Commander (Operations Manager)
-
Responsible for daily dispatching of city traffic and safety resources.
-
Information Overload. Facing thousands of sensor alerts, unable to distinguish critical issues from noise.
-
Intelligent Triage.
System automatically filters low-priority noise.
Aggregates related alarms in the same area (e.g., Intersection Accident + Congestion + Camera Fault) into a single "Incident Case."
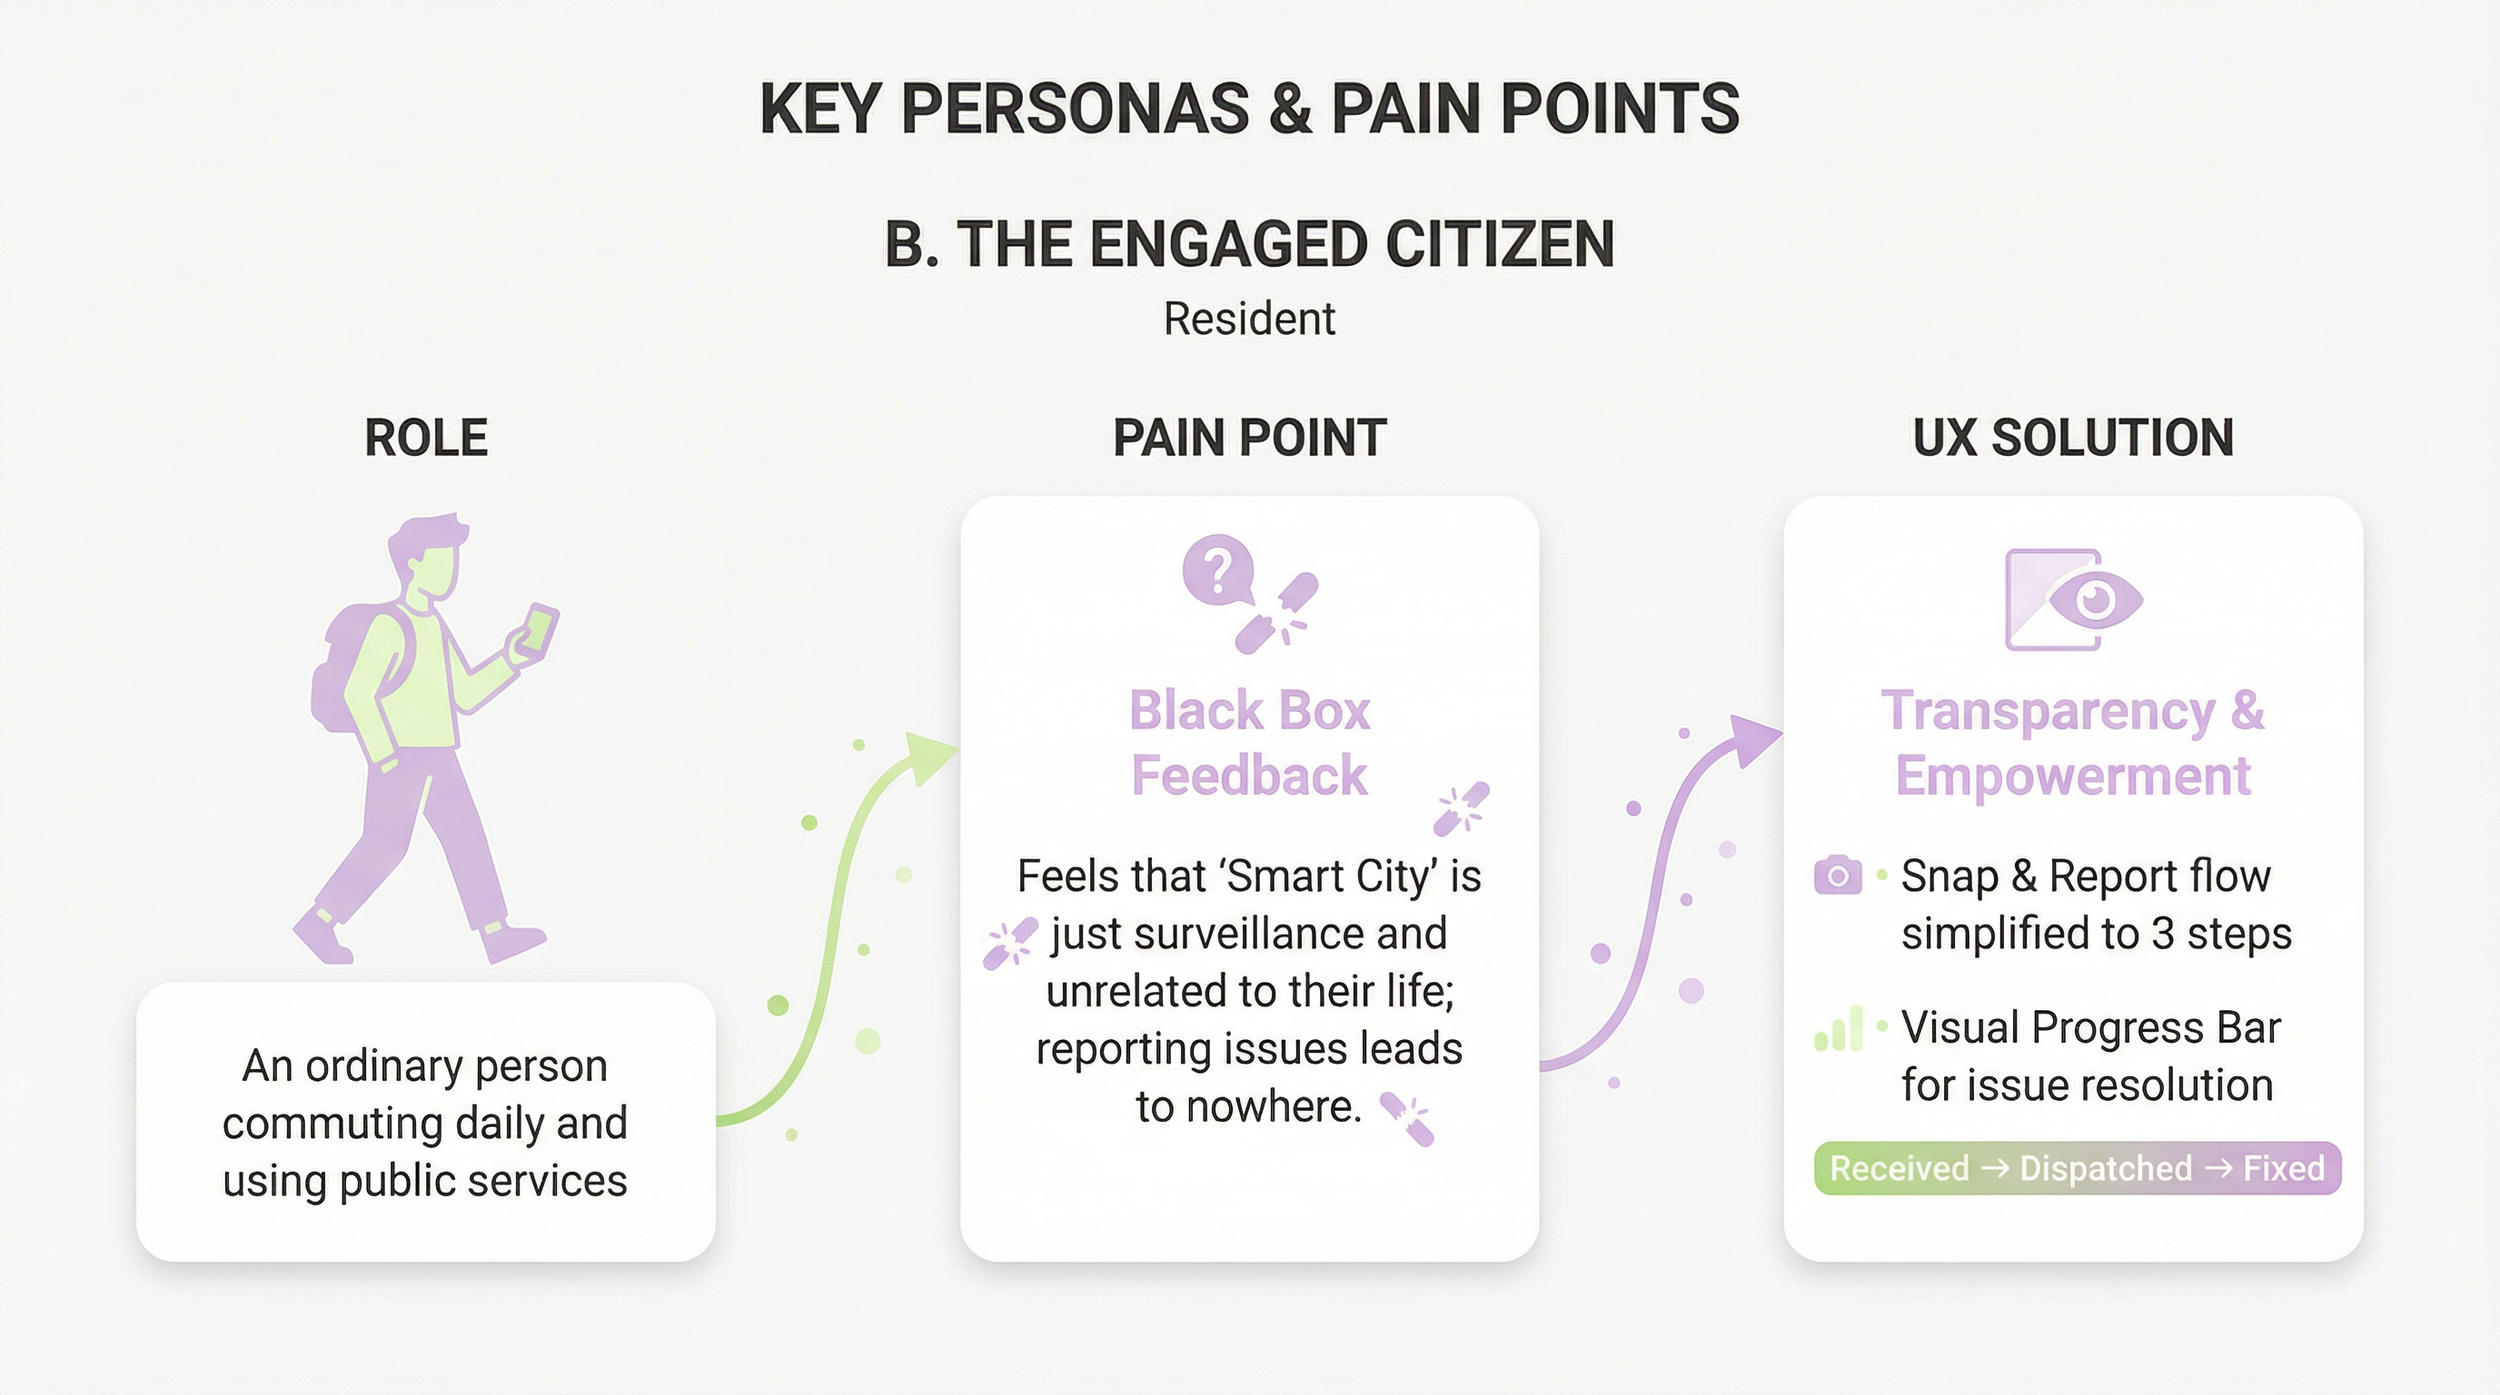
B. The Engaged Citizen (Resident)
-
An ordinary person commuting daily and using public services.
-
Black Box Feedback. Feels that "Smart City" is just surveillance and unrelated to their life; reporting issues leads to nowhere.
-
Transparency & Empowerment.
"Snap & Report" flow simplified to 3 steps.
Visual Progress Bar for issue resolution (Received -> Dispatched -> Fixed).
4.0 Interaction Architecture & Logic Flows
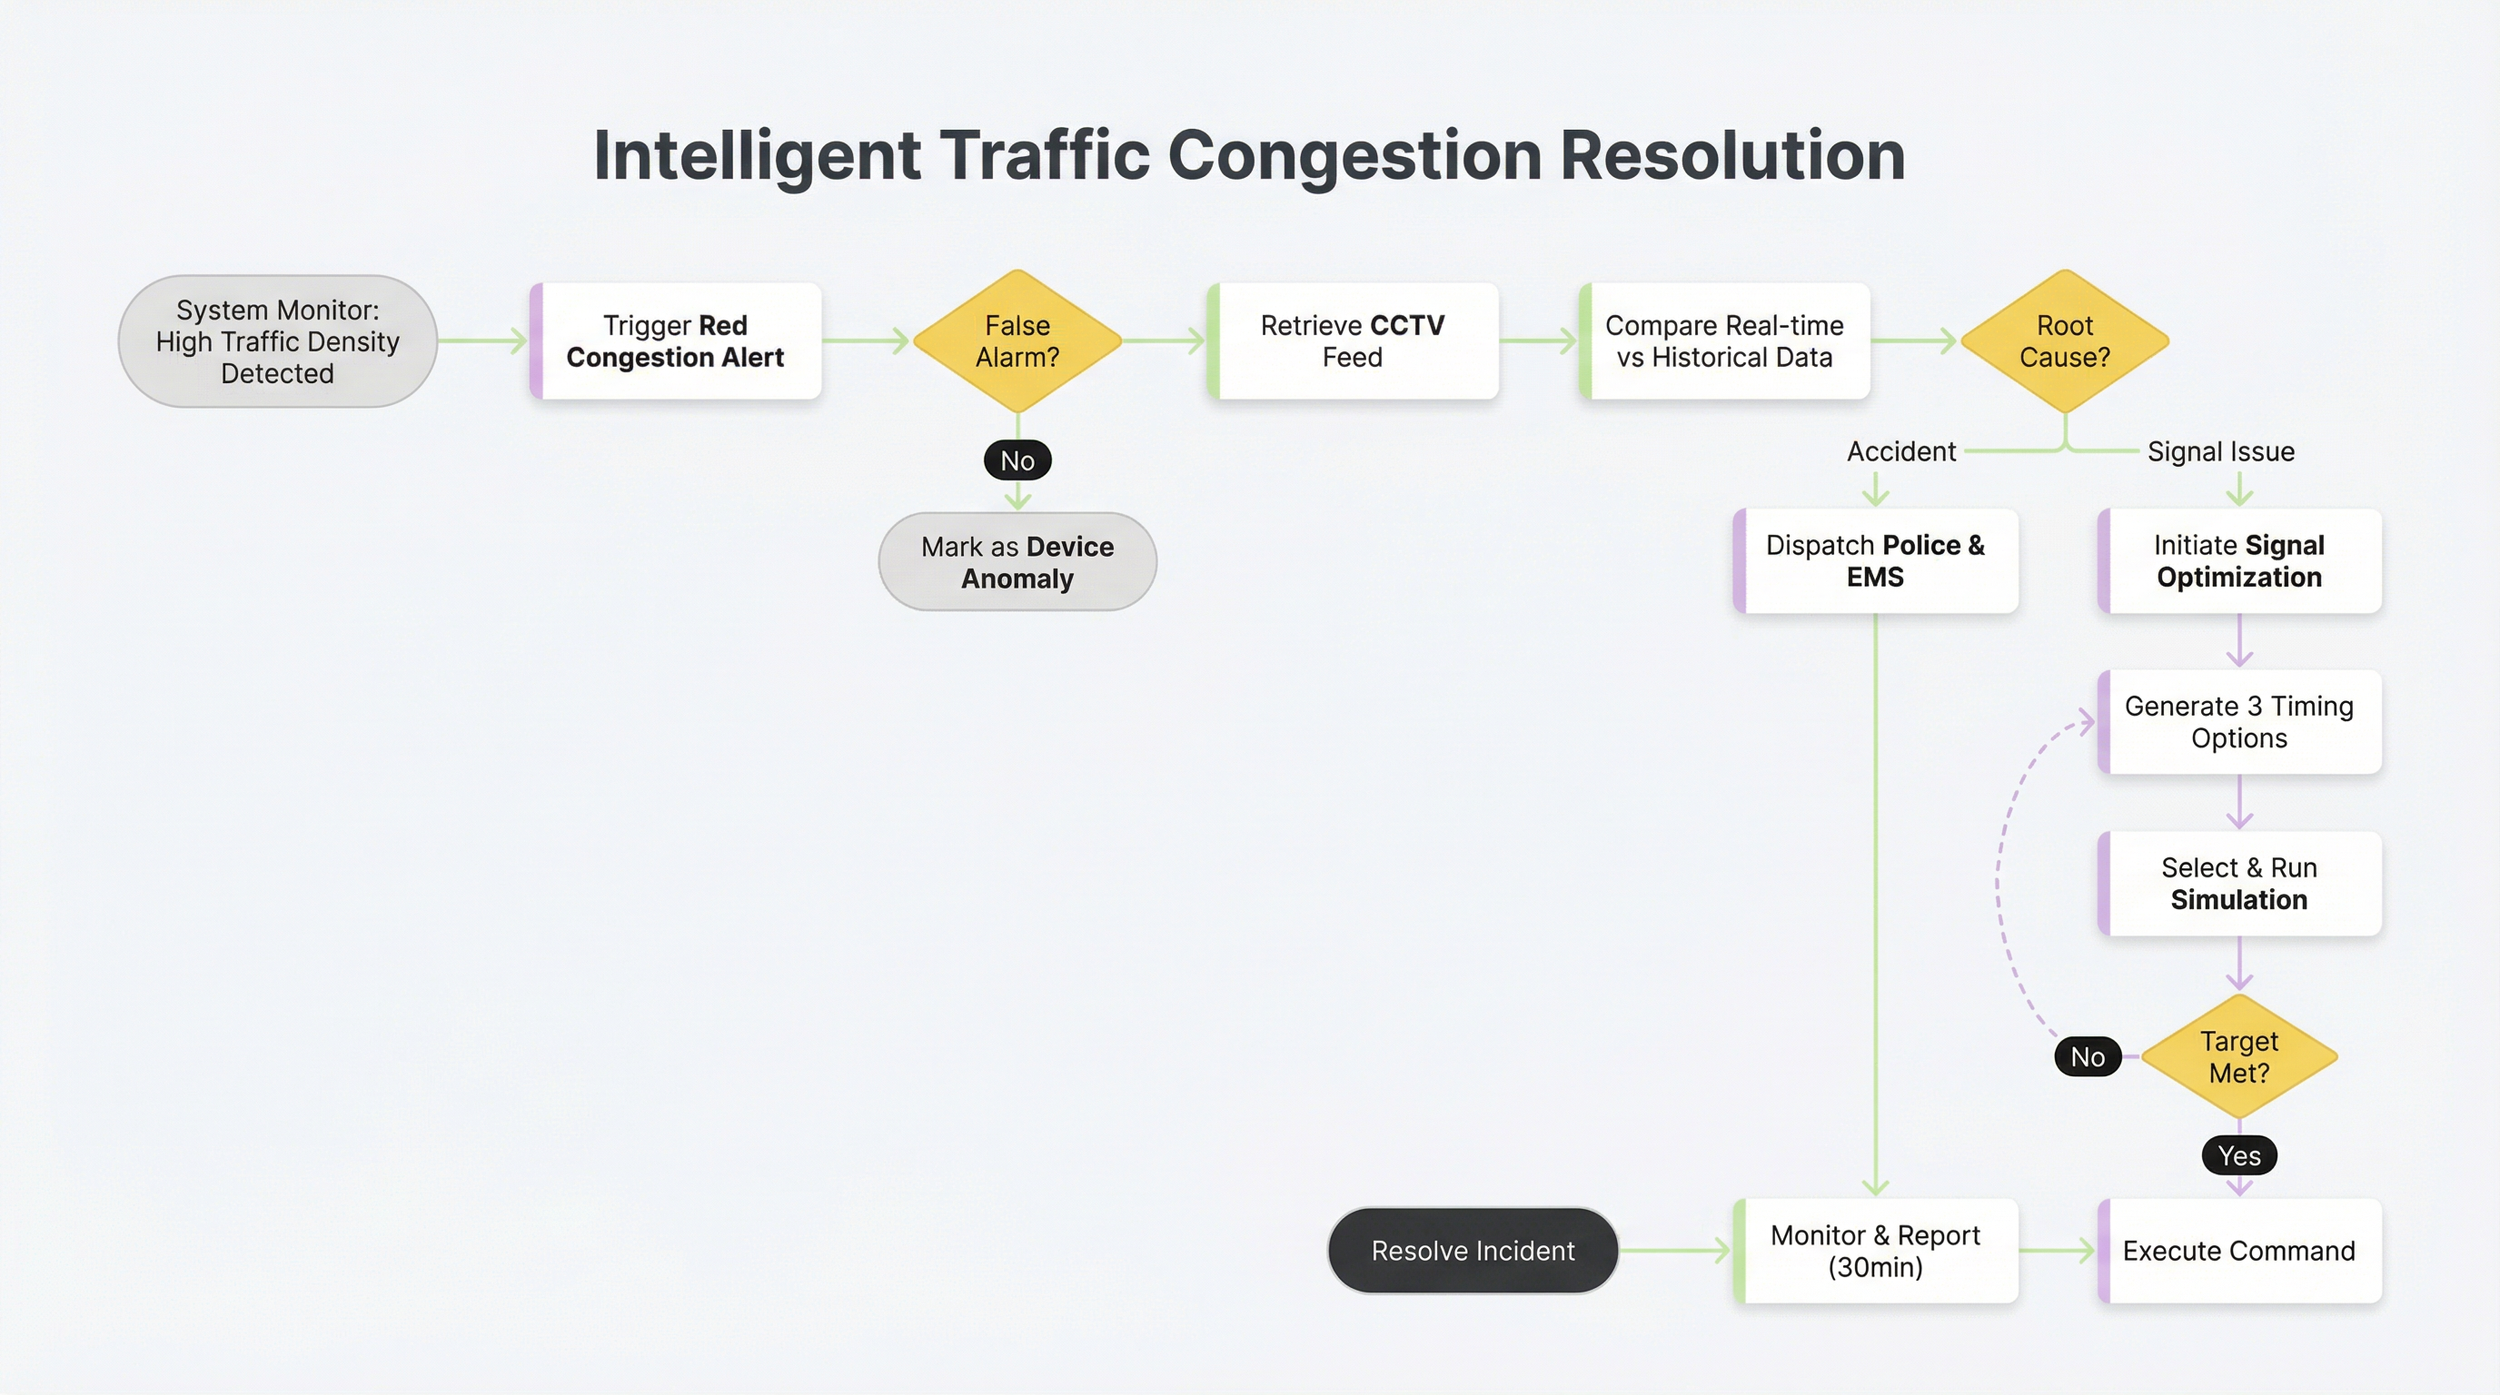
4.1 Core Workflow: Intelligent Traffic Congestion Resolution
This flowchart illustrates how the system assists the manager from issue detection to resolution.
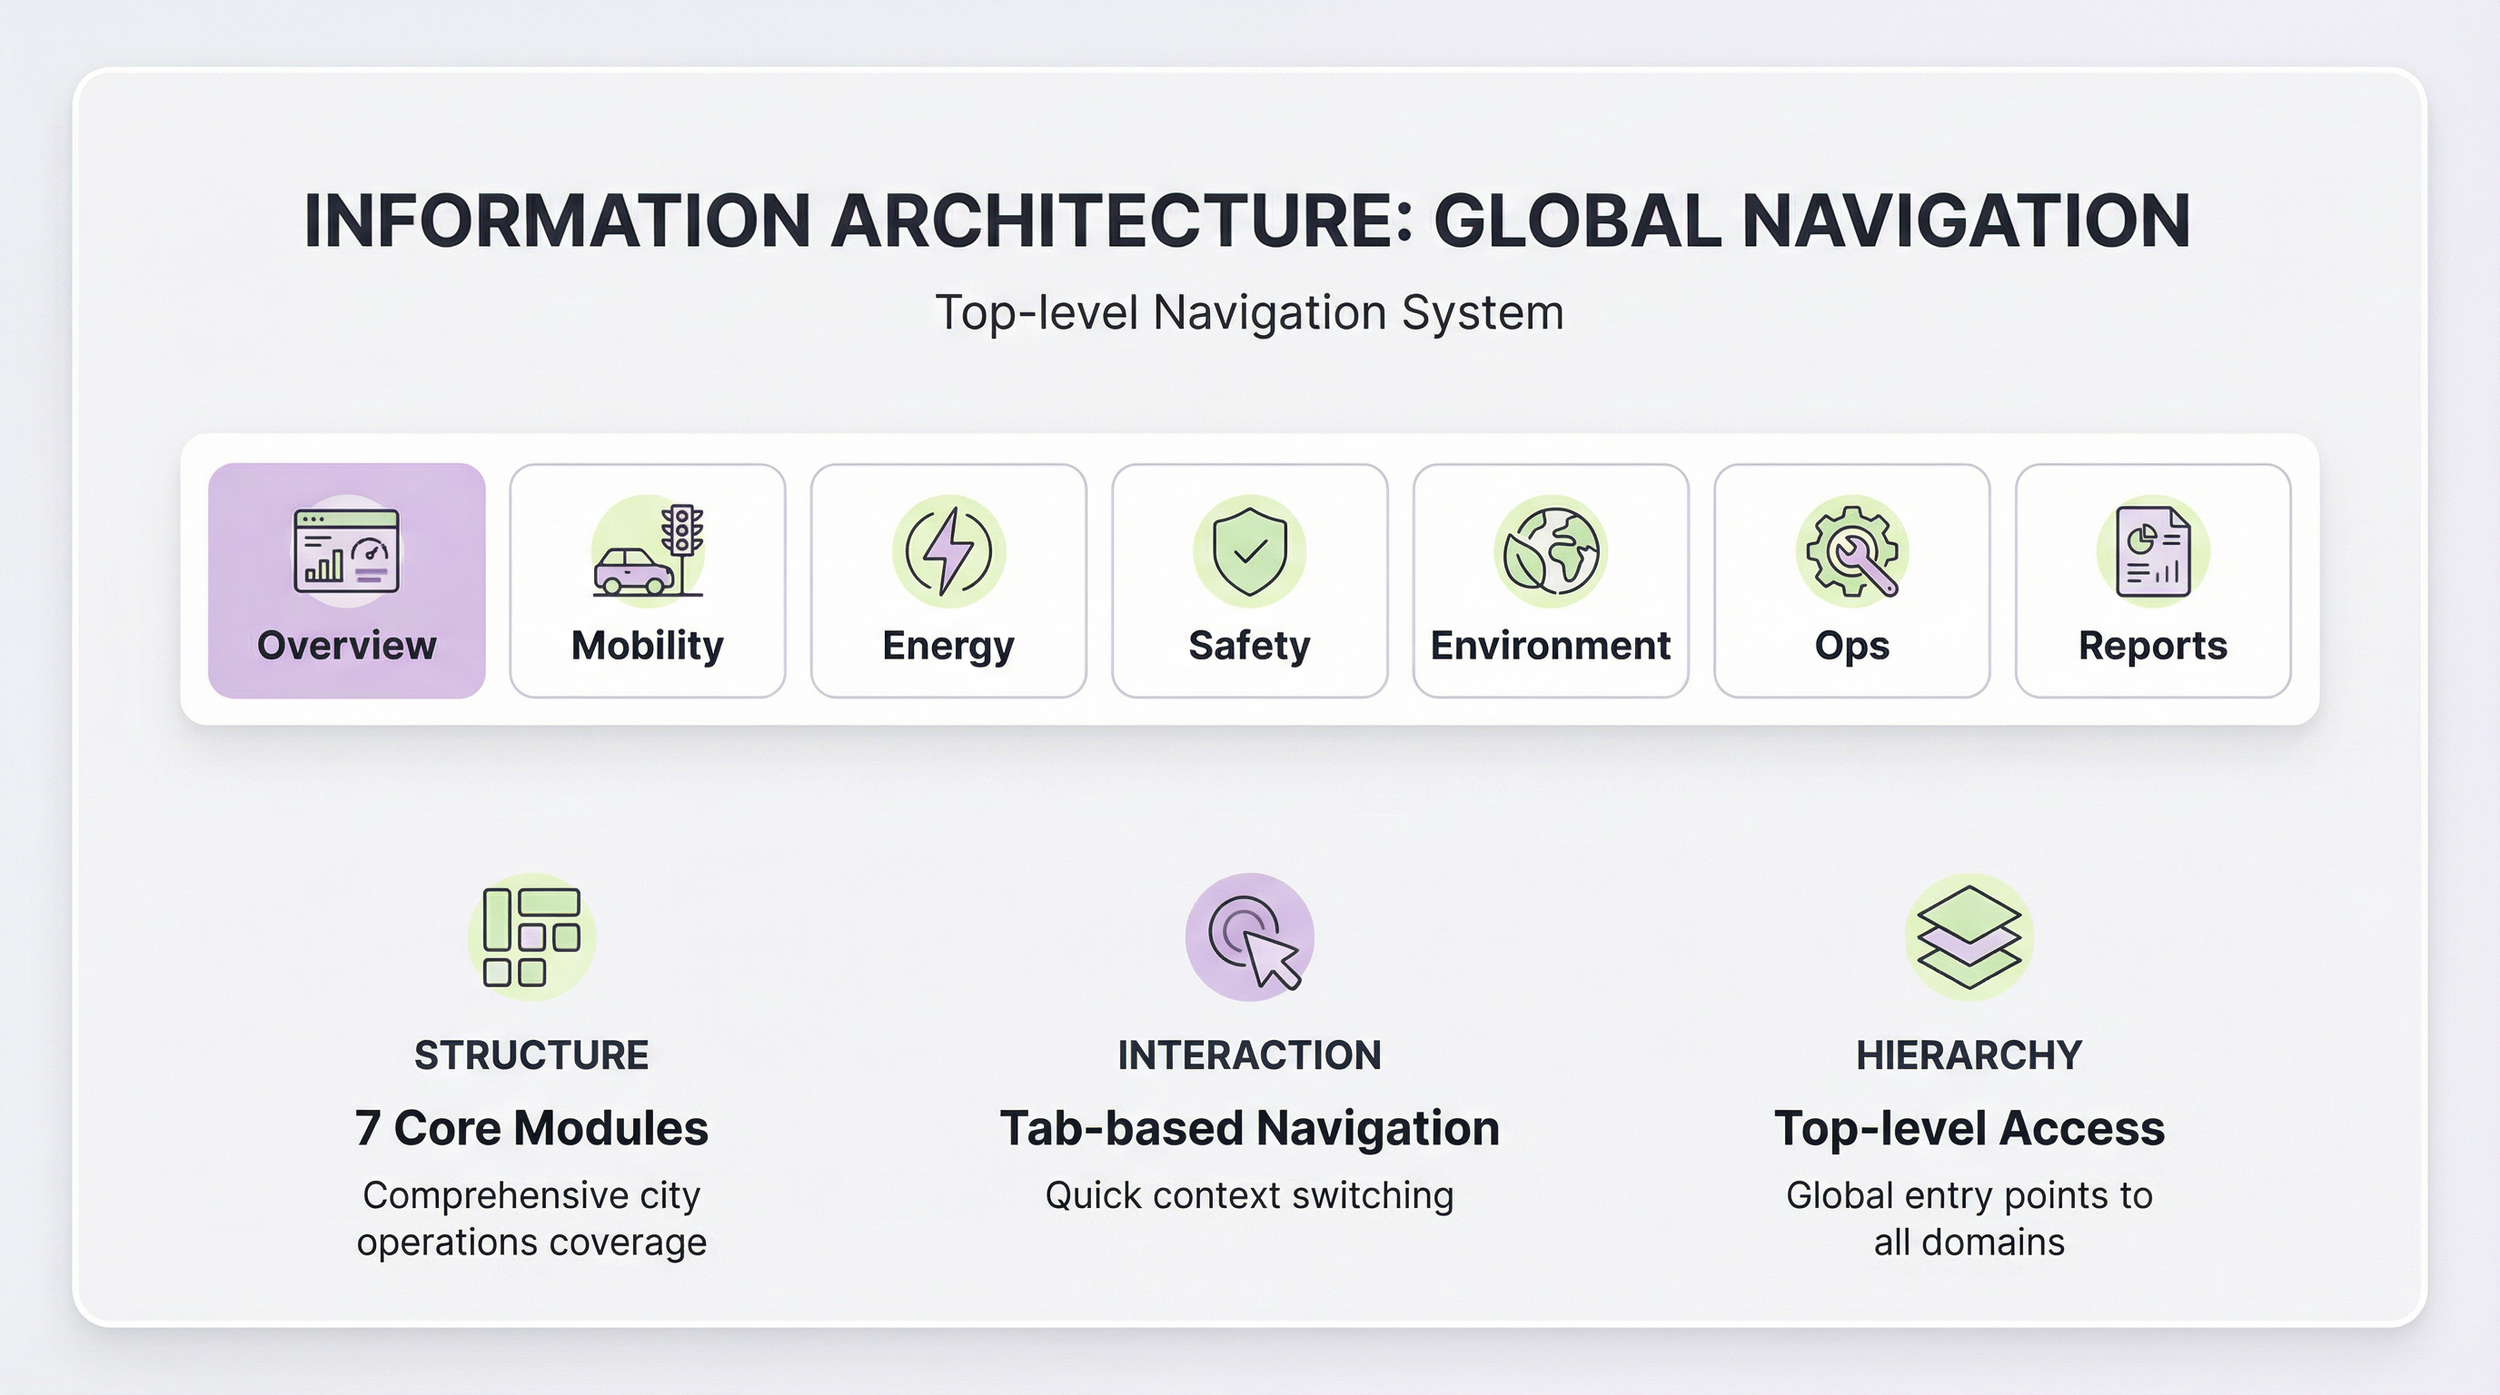
4.2 Information Architecture (IA) - City Dashboard
-
Overview | Mobility | Energy | Safety | Environment | Ops | Reports
-
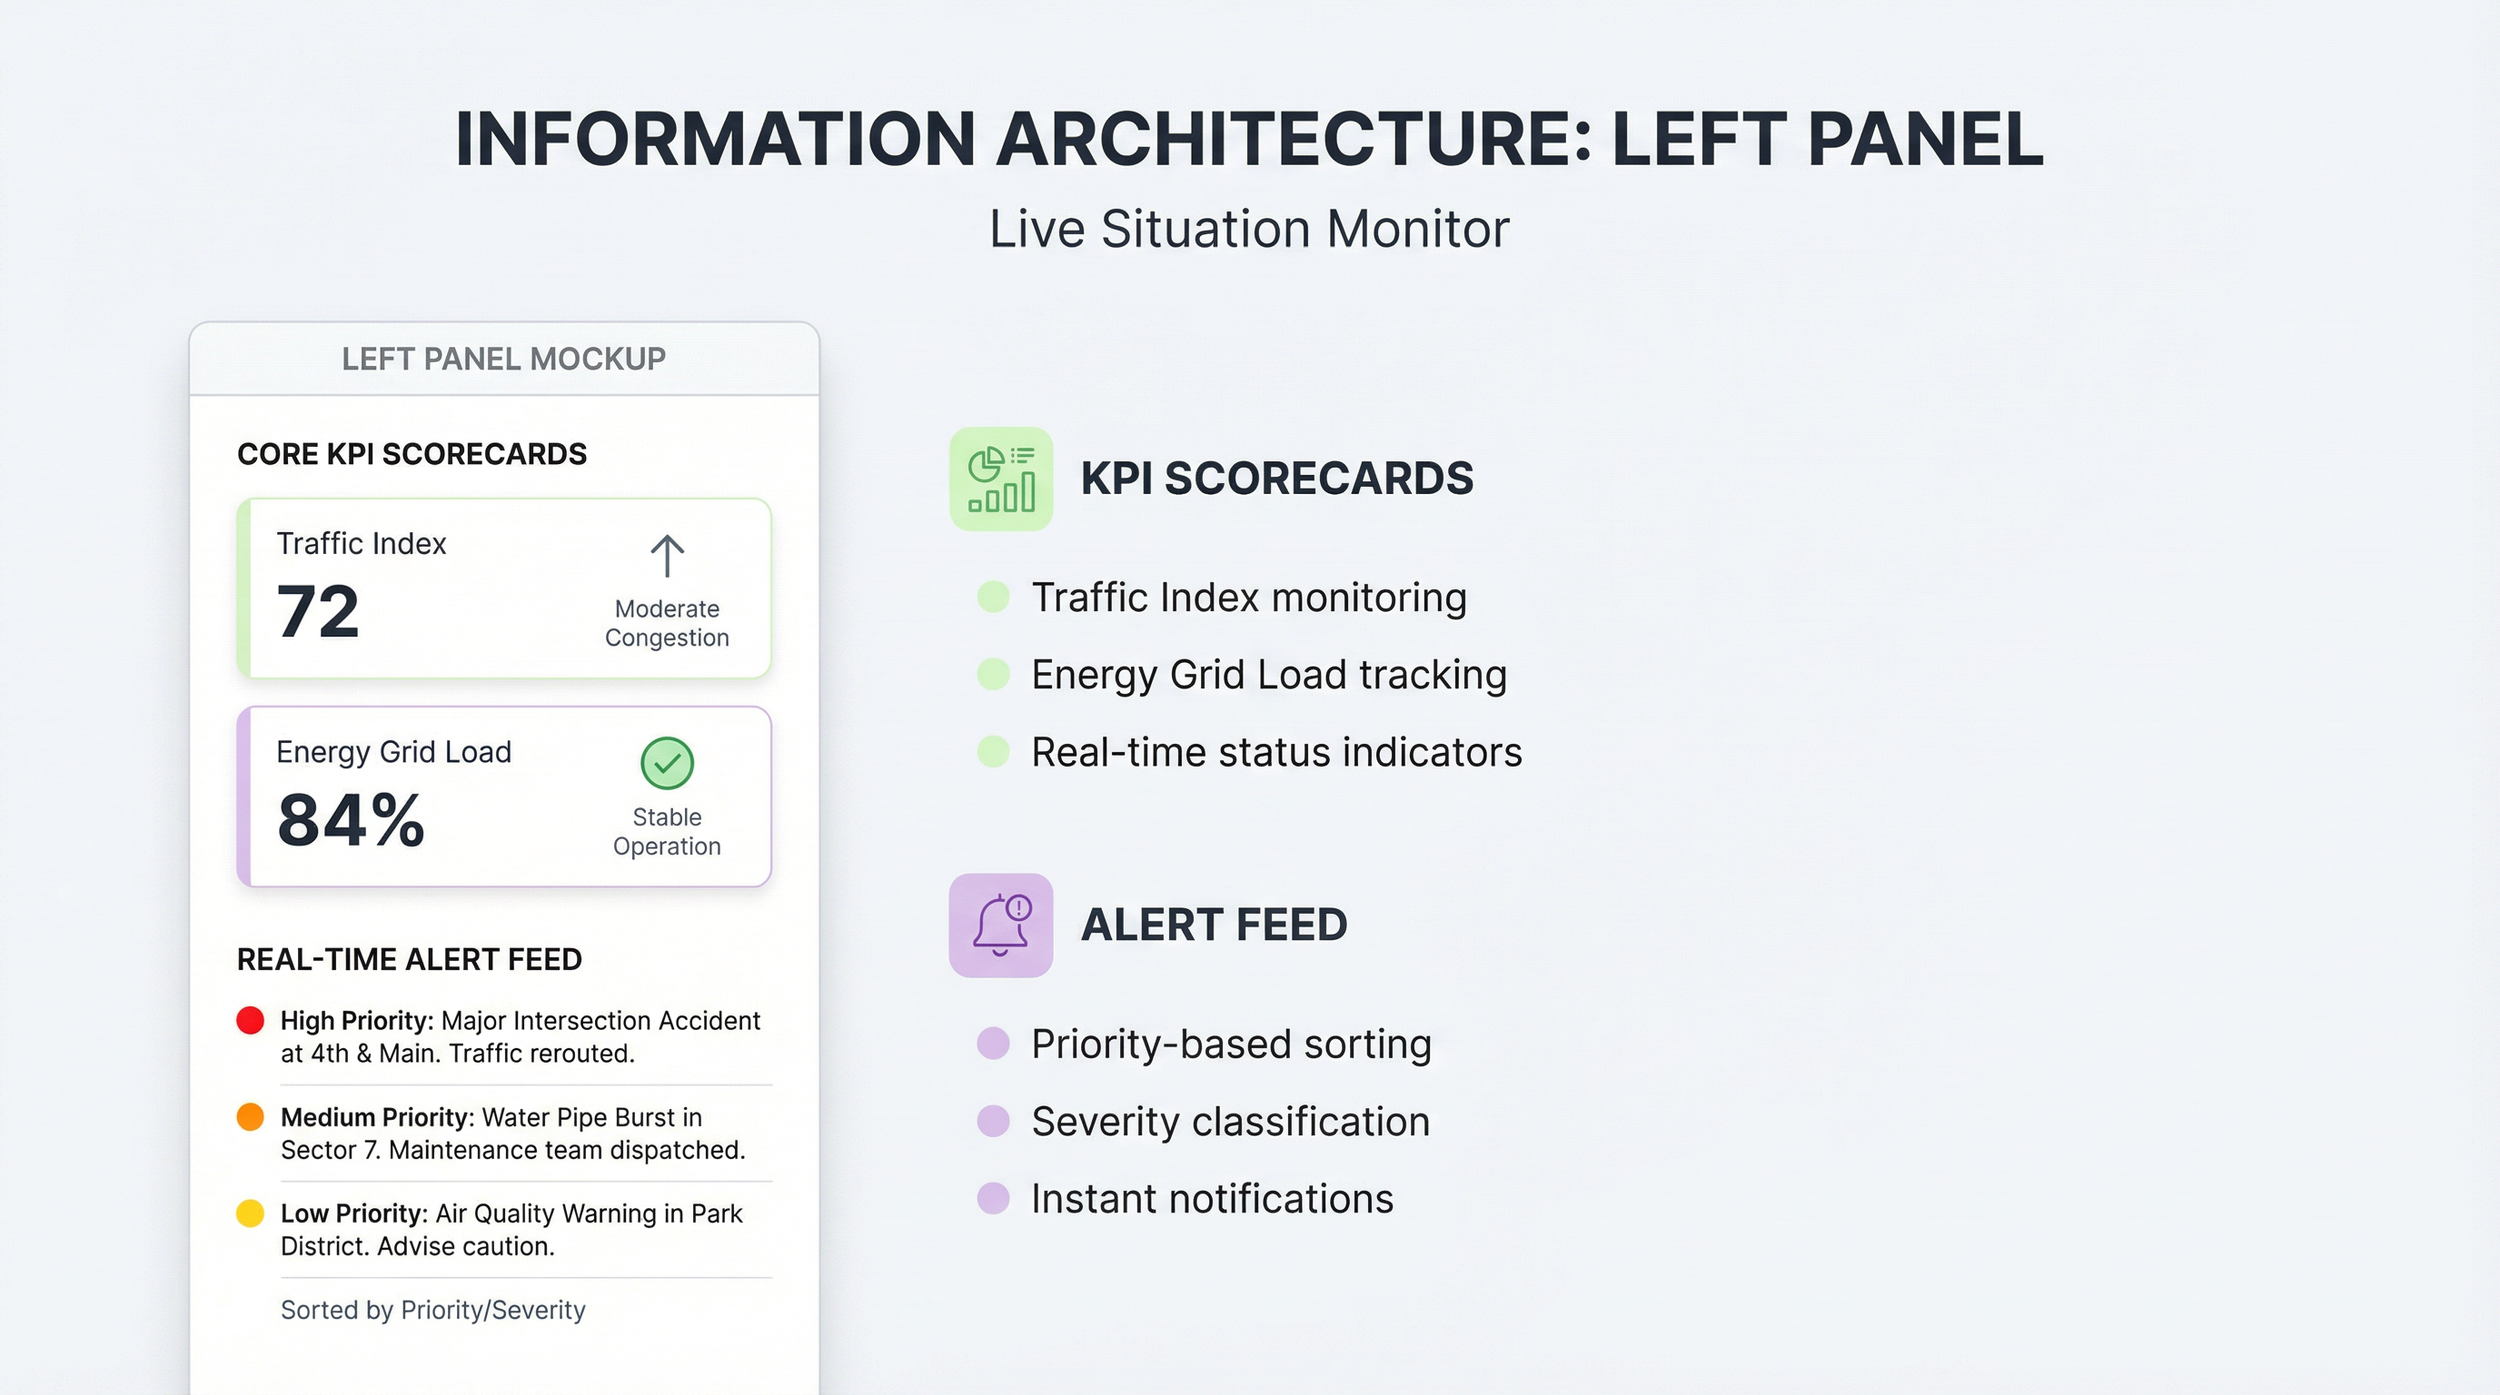
Core KPI Scorecards (Traffic Index, Energy Grid Load).
Real-time Alert Feed (Sorted by Priority/Severity).
-
Interactive GIS Map (Zoom, Pan, Tilt).
Layer Controller (Toggle Infrastructure/Data Layers).
Object Pop-over (Details on hover/click).

-
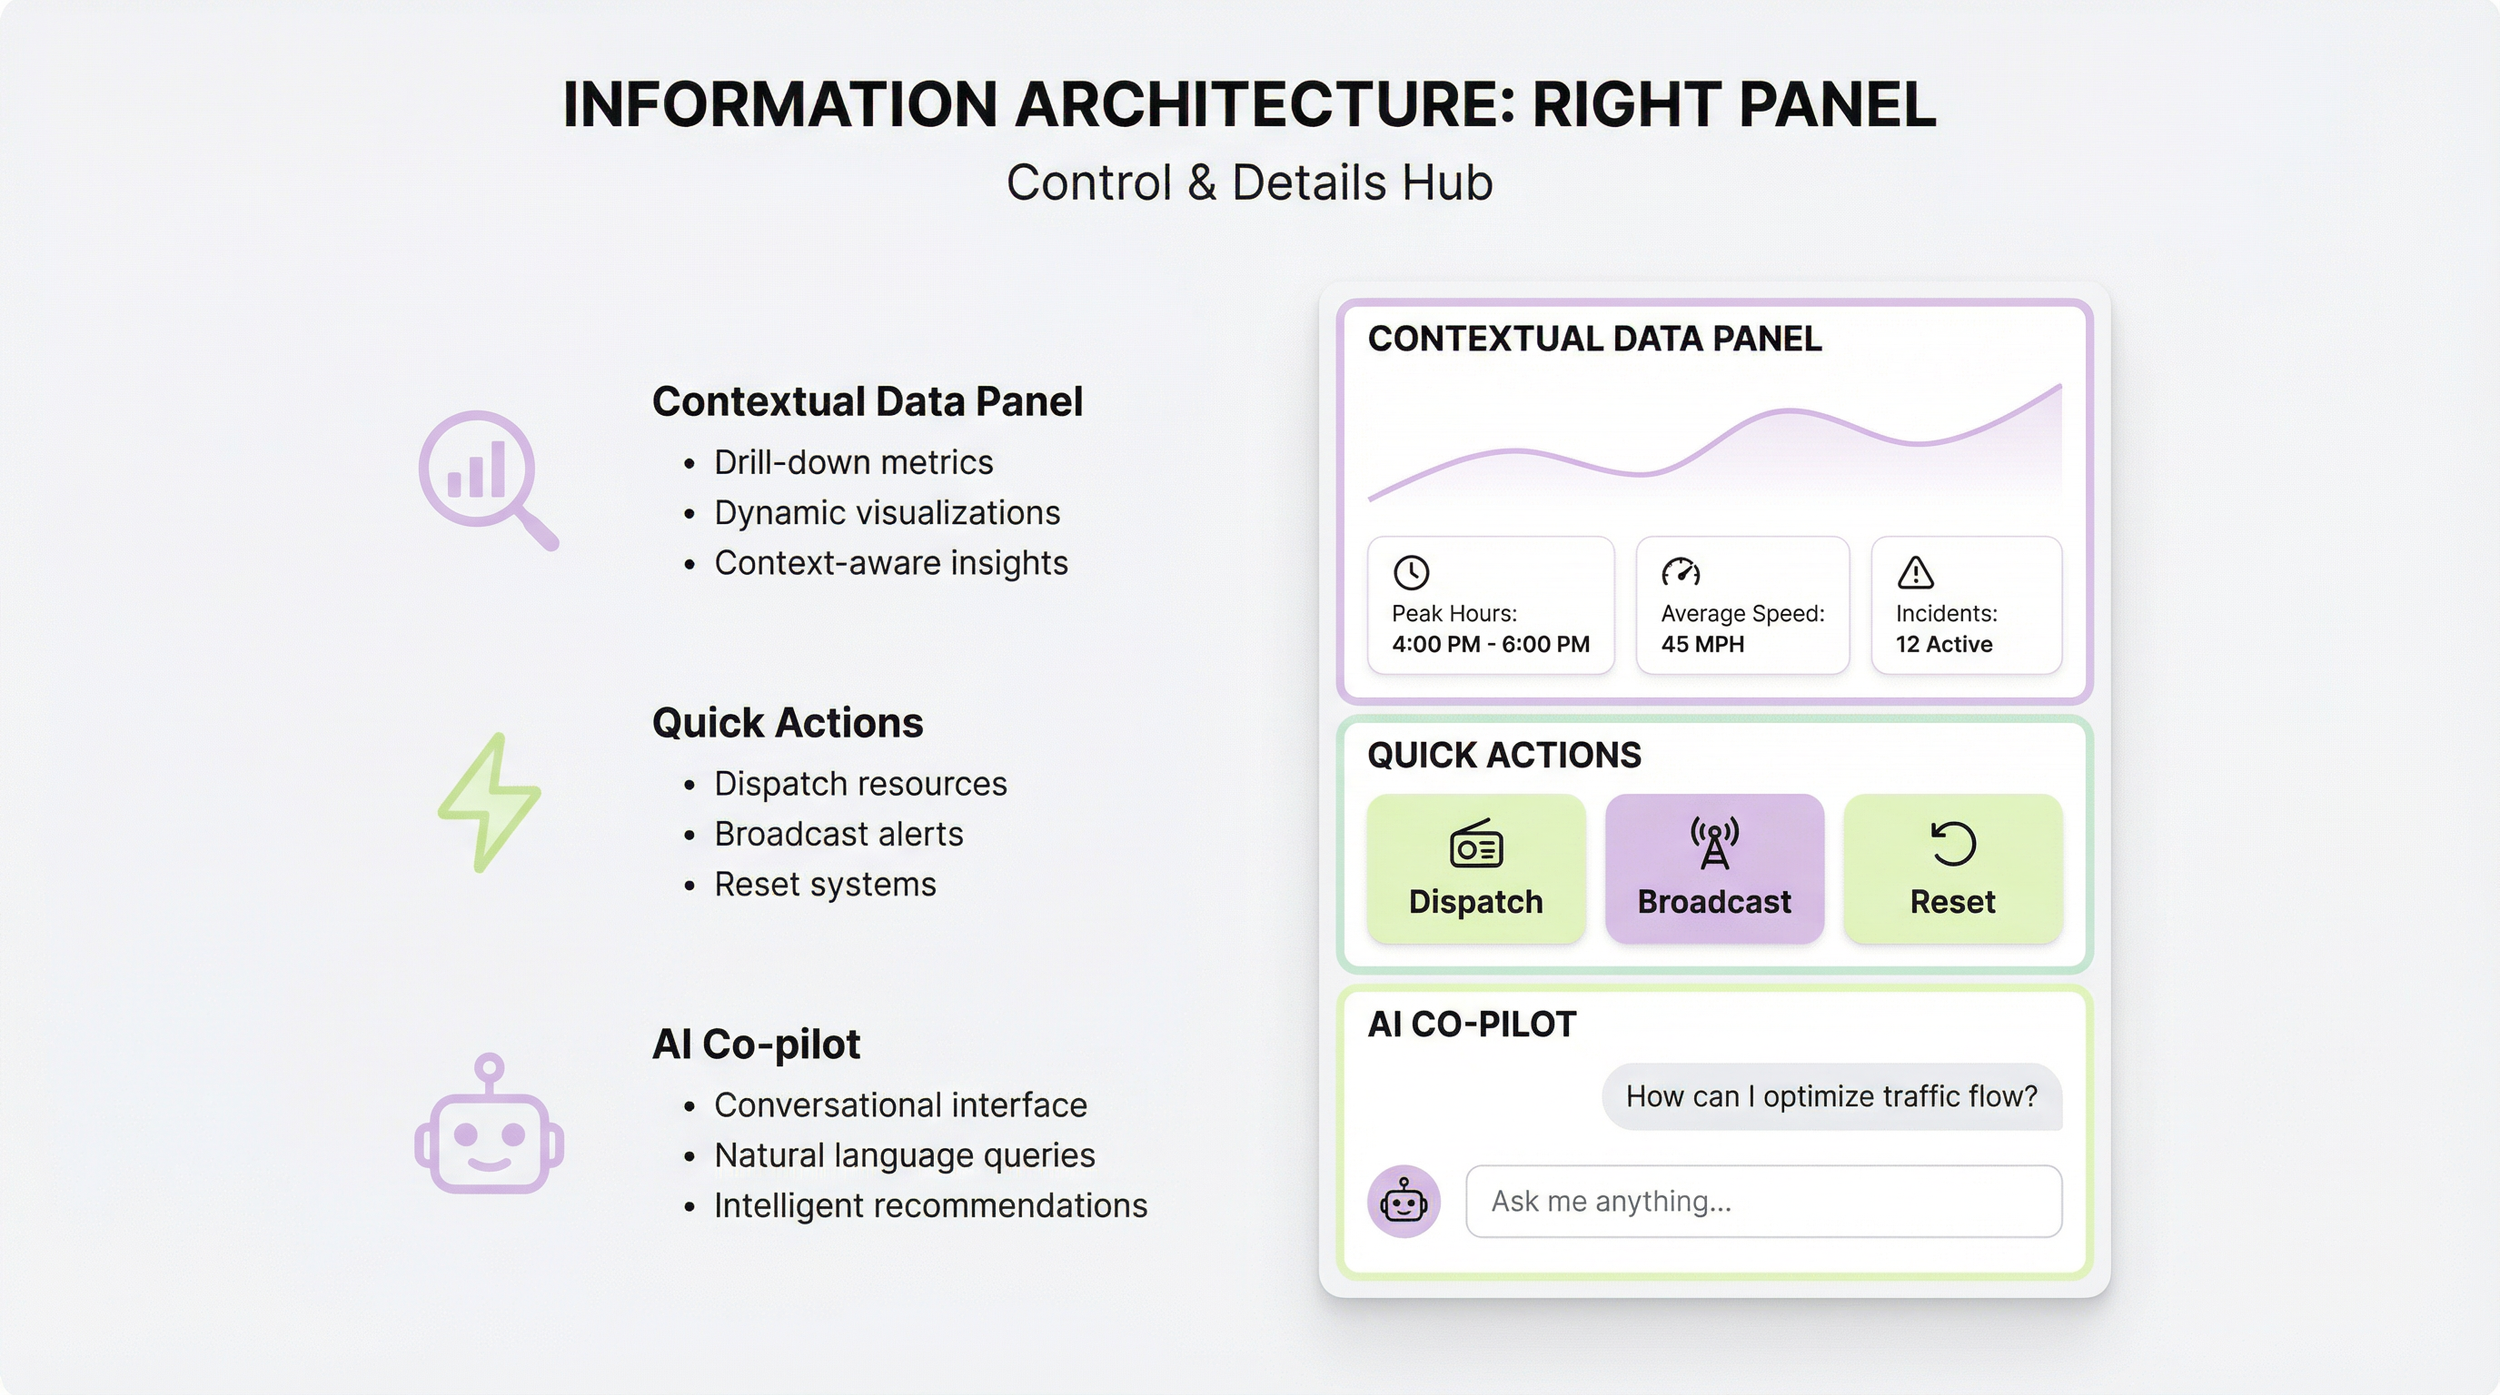
Contextual Data Panel (Drill-down metrics).
Quick Actions (Dispatch, Broadcast, Reset).
AI Co-pilot (Conversational Assistant).
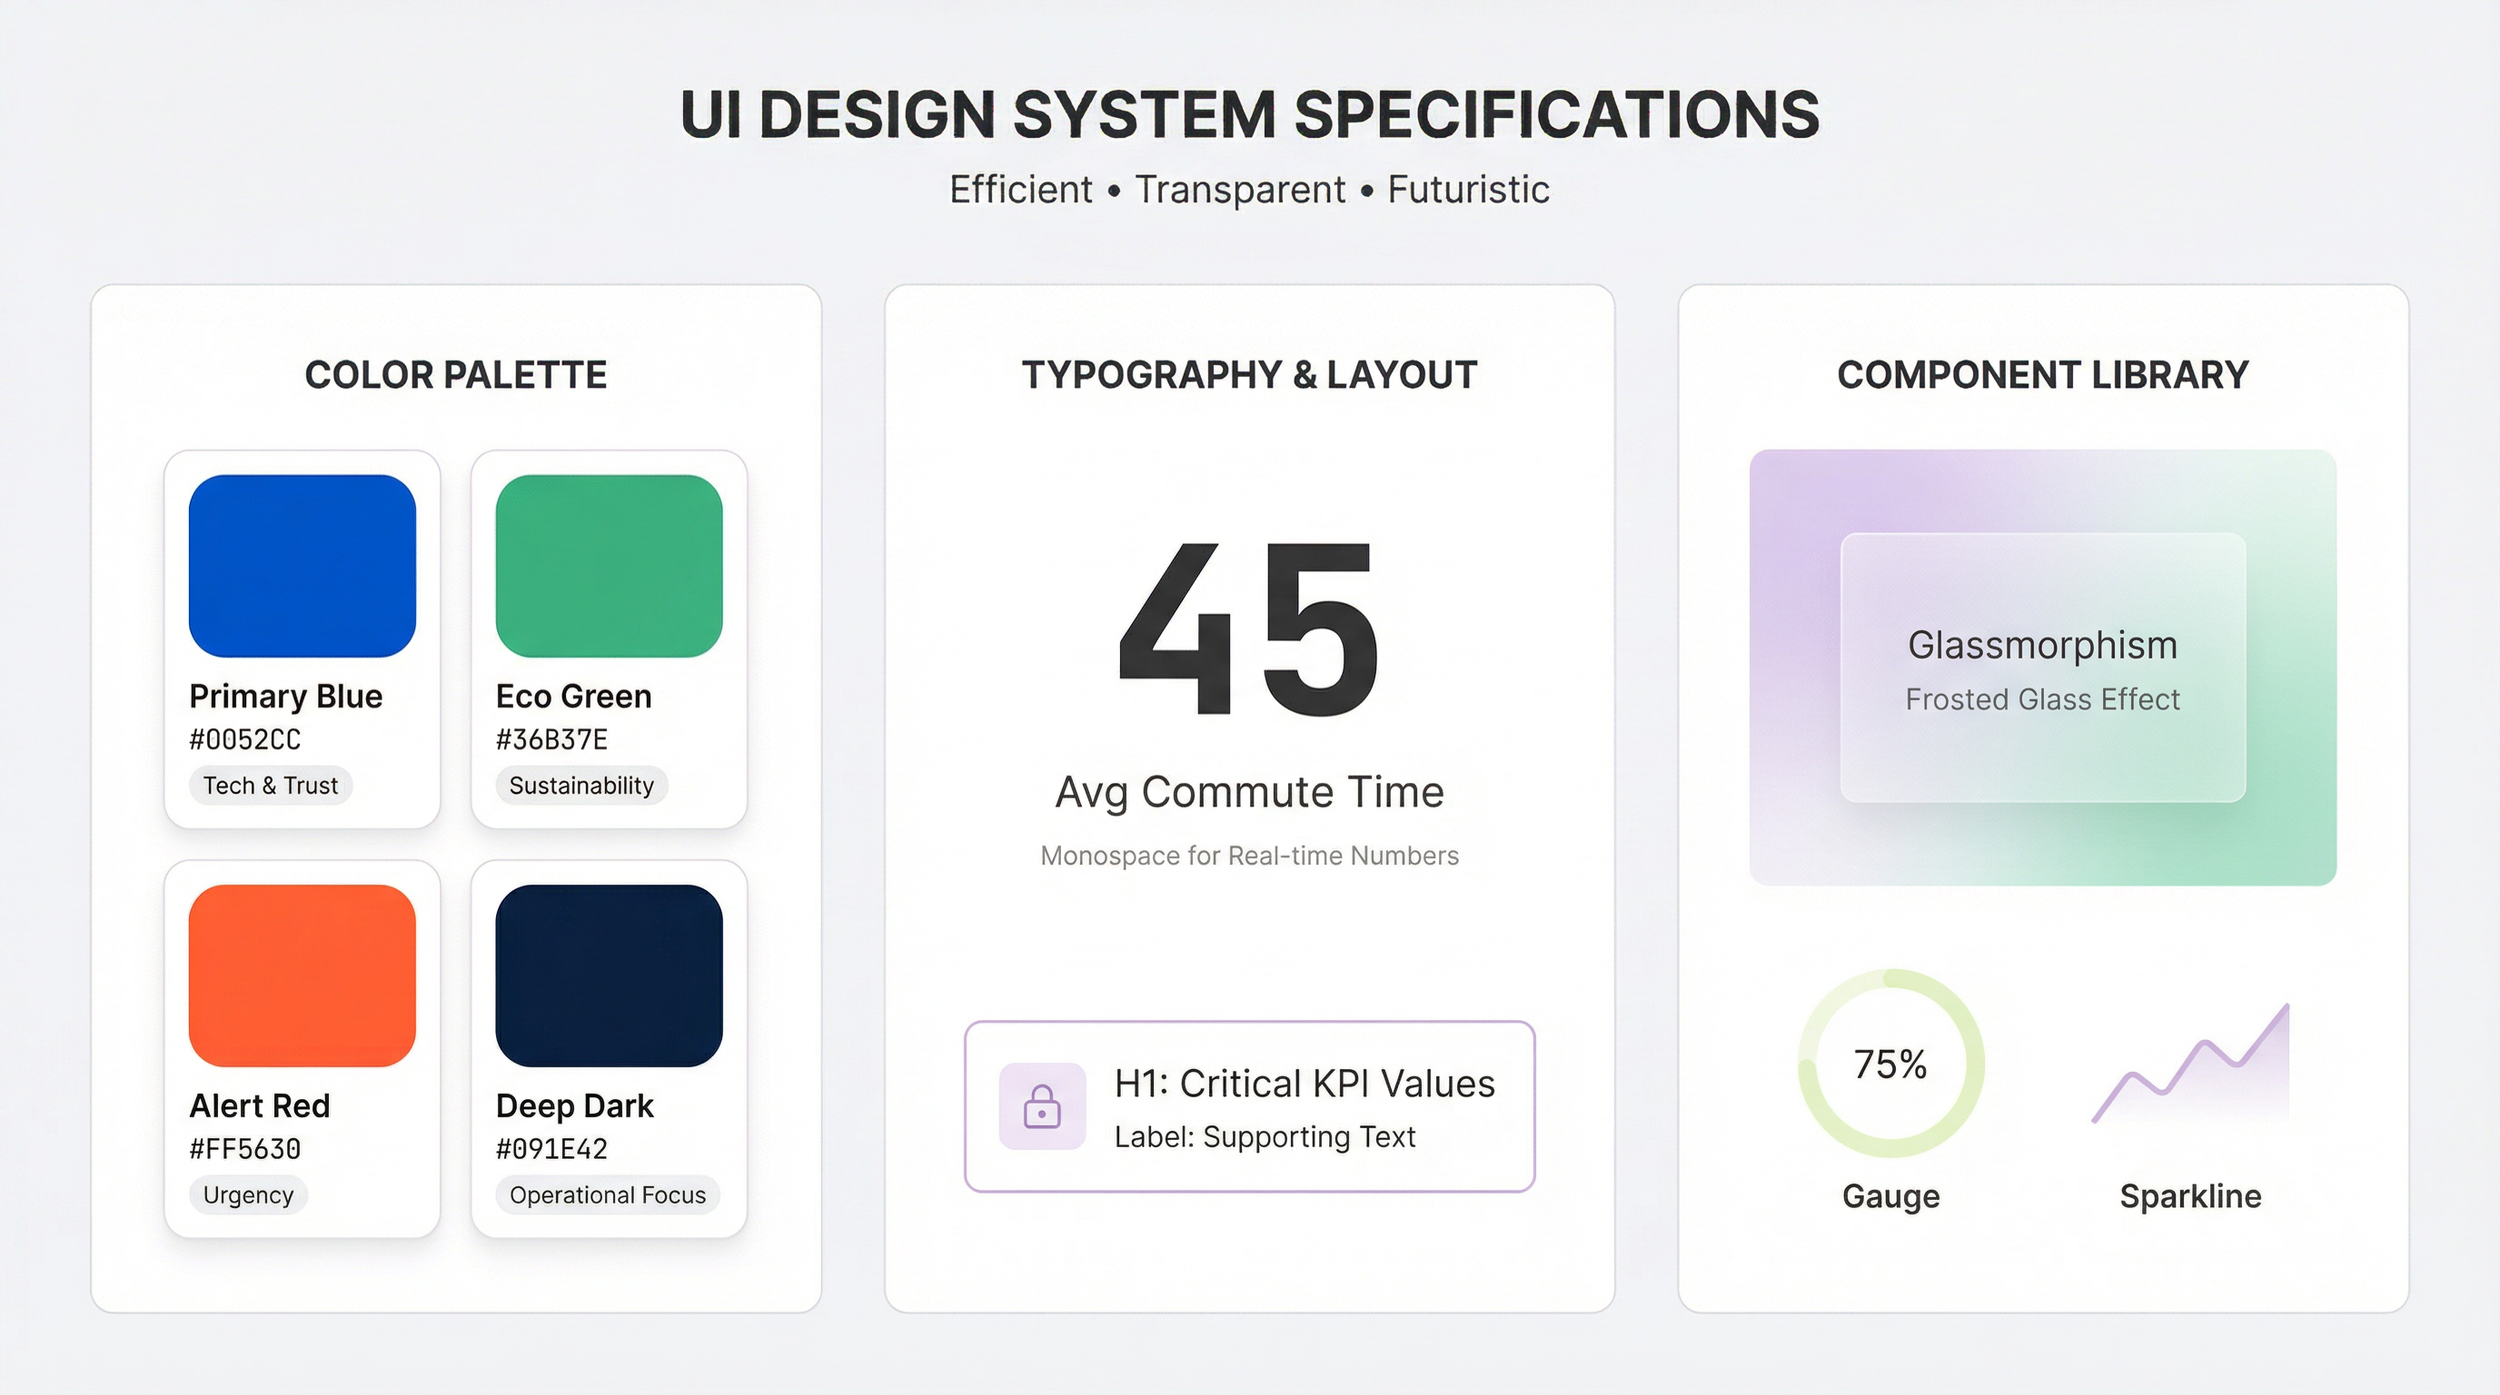
5. UI Design System Specifications
6.0 Validation, Risks & Roadmap
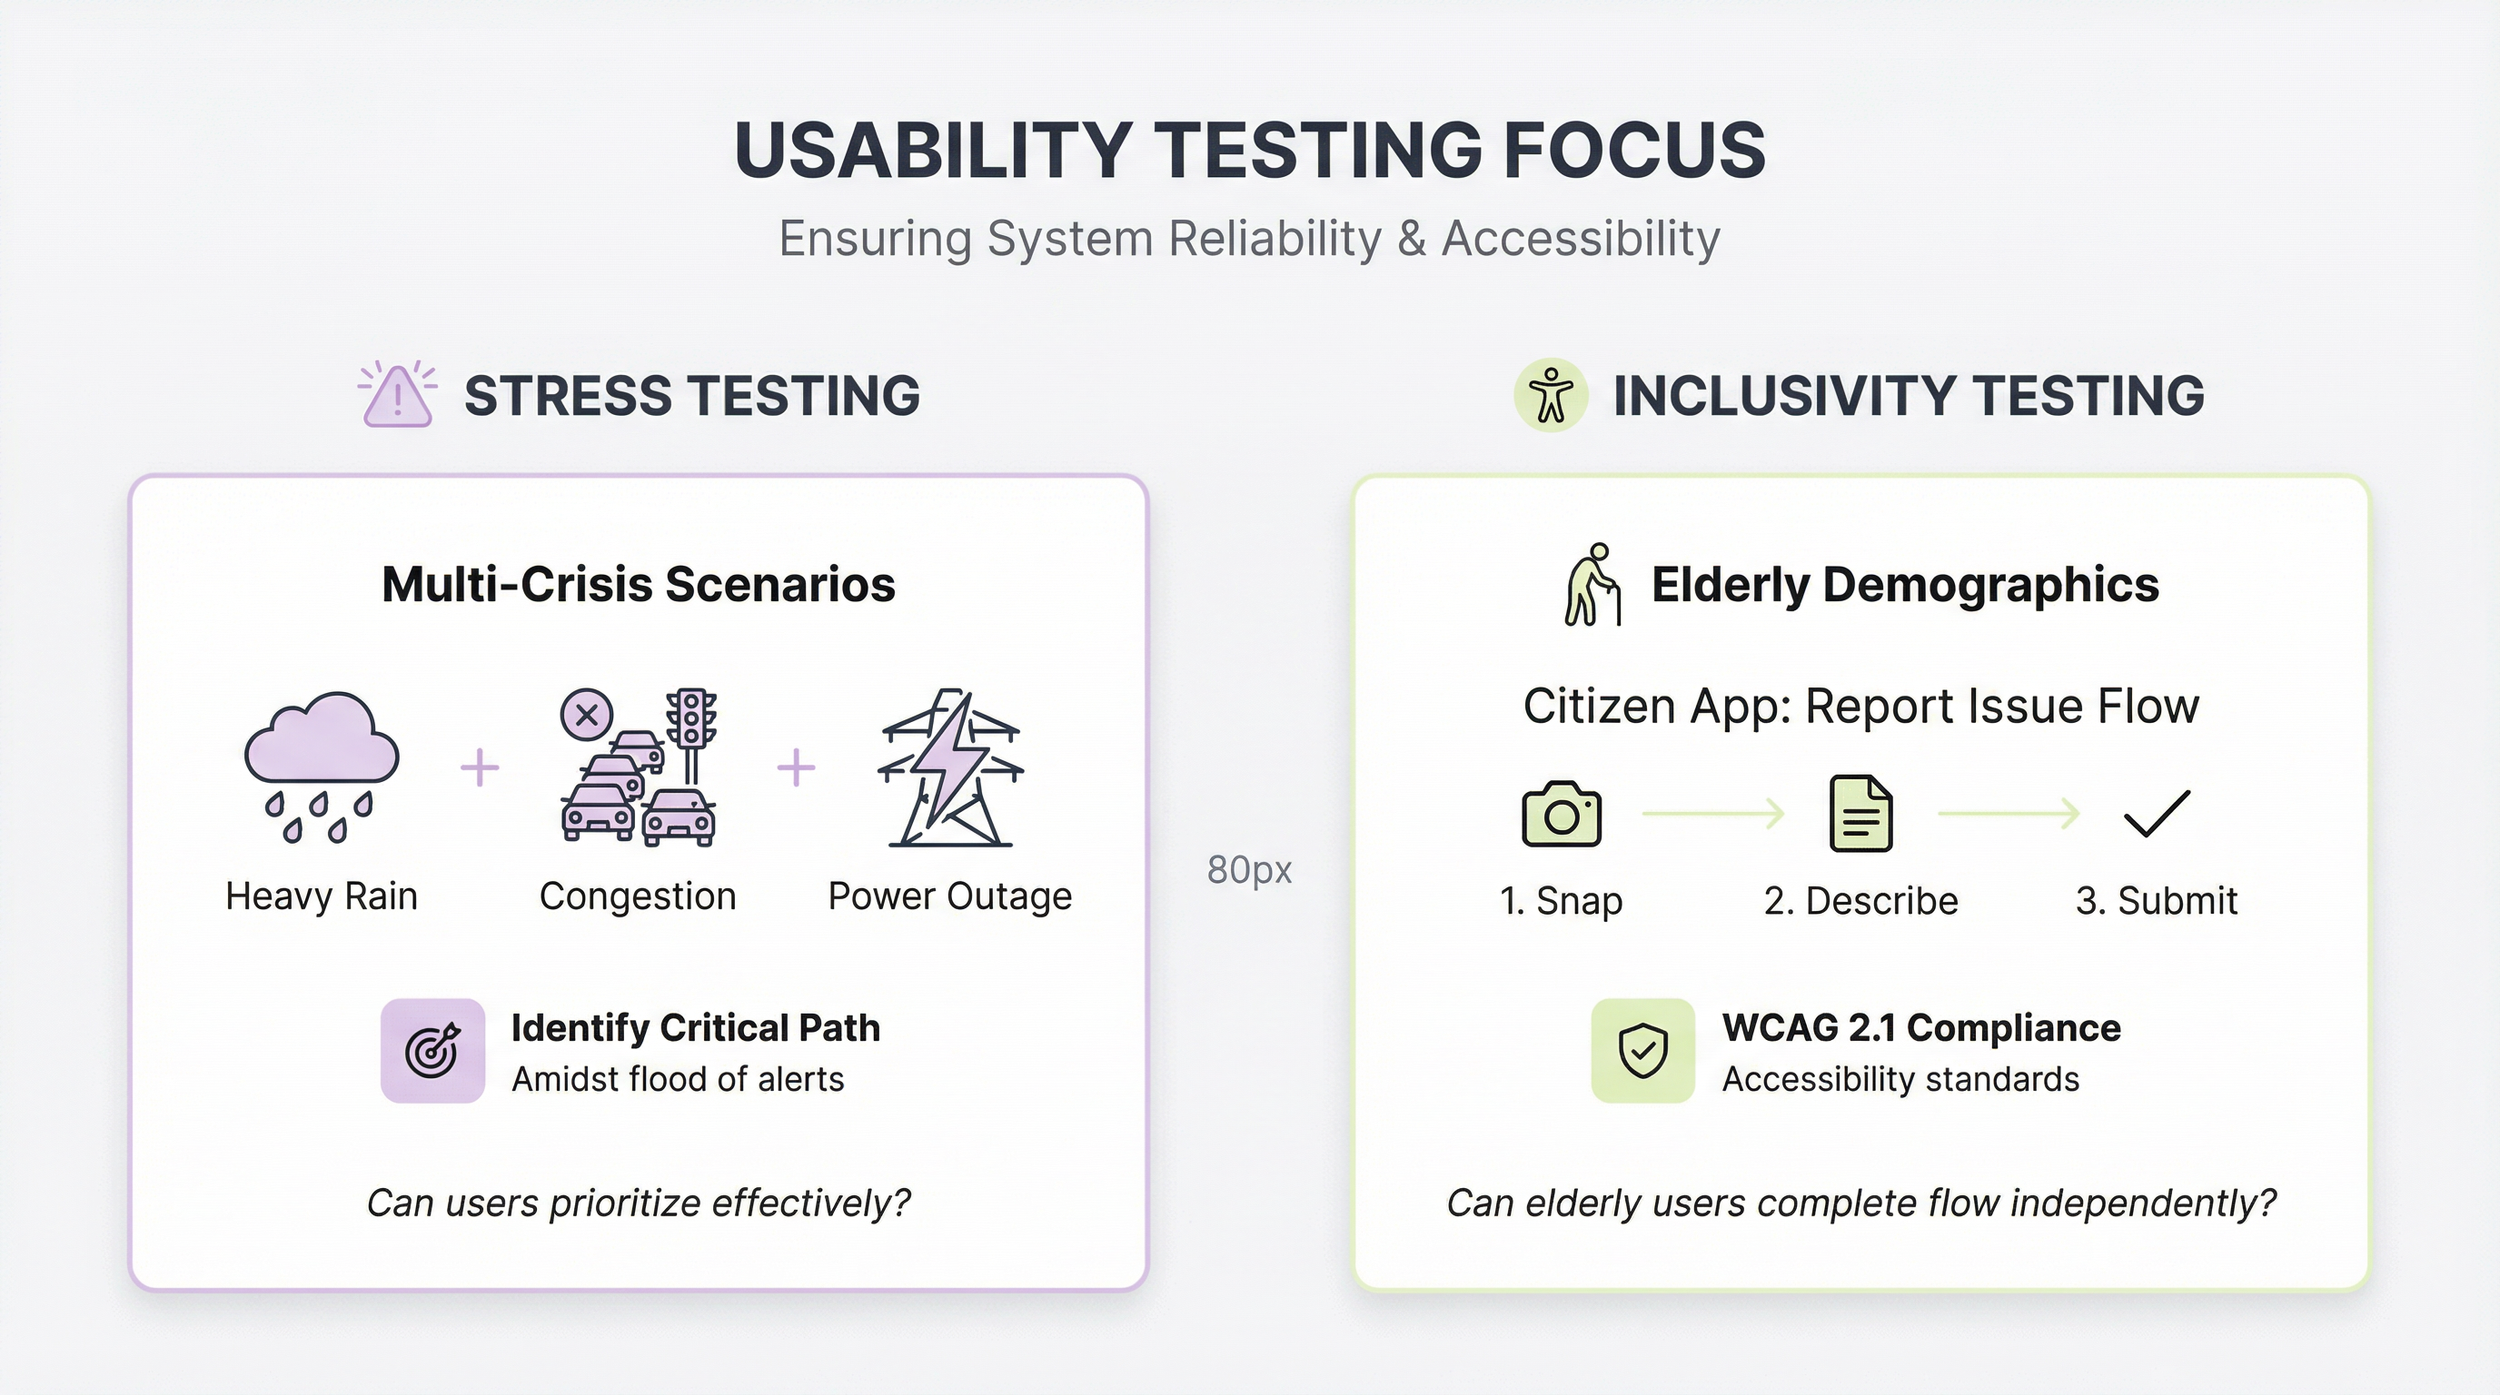
6.1 Usability Testing Focus
-
Simulate "Multi-Crisis Scenarios" (e.g., Heavy Rain + Congestion + Power Outage) to observe if users can identify the critical path amidst a flood of alerts.
-
Test the Citizen App's "Report Issue" flow with elderly demographics to ensure accessibility compliance (WCAG 2.1).
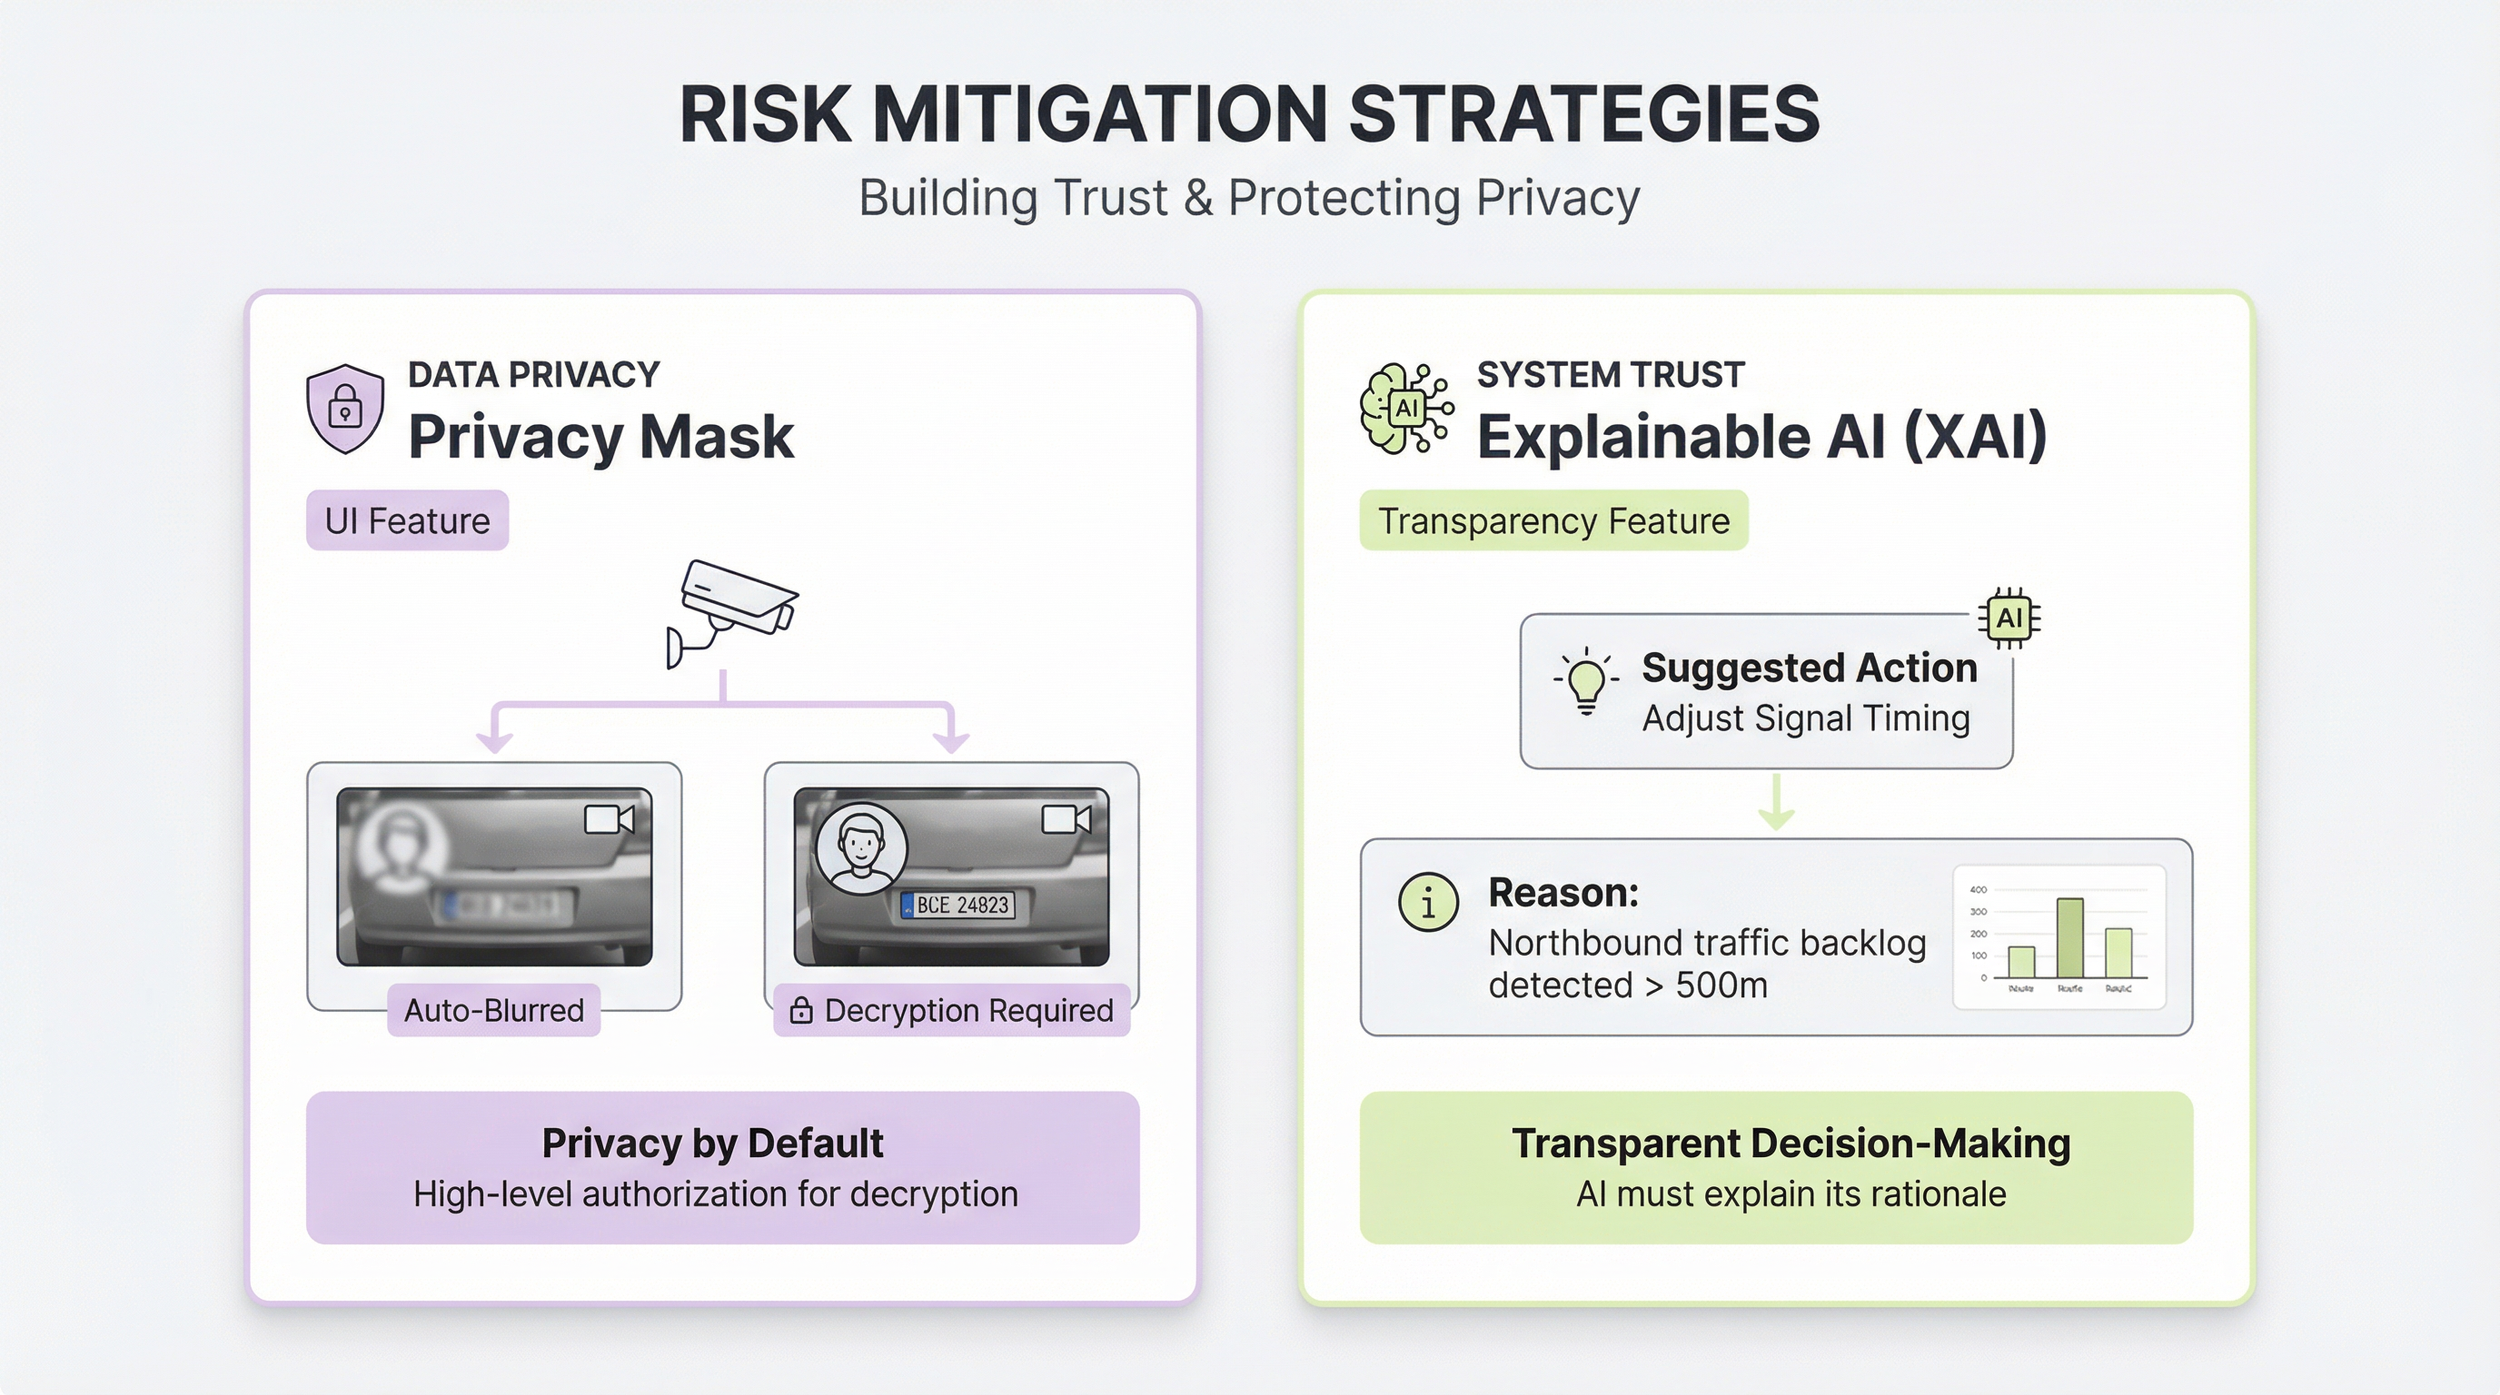
6.2 Risk Mitigation Strategies
-
Implement a "Privacy Mask" feature in the UI. When operators view CCTV, faces and license plates are automatically blurred unless high-level decryption authorization is granted.
-
Introduce "Explainable AI (XAI)" tags. When the system suggests a signal change, it must display the rationale: "Reason: Northbound traffic backlog detected > 500m."
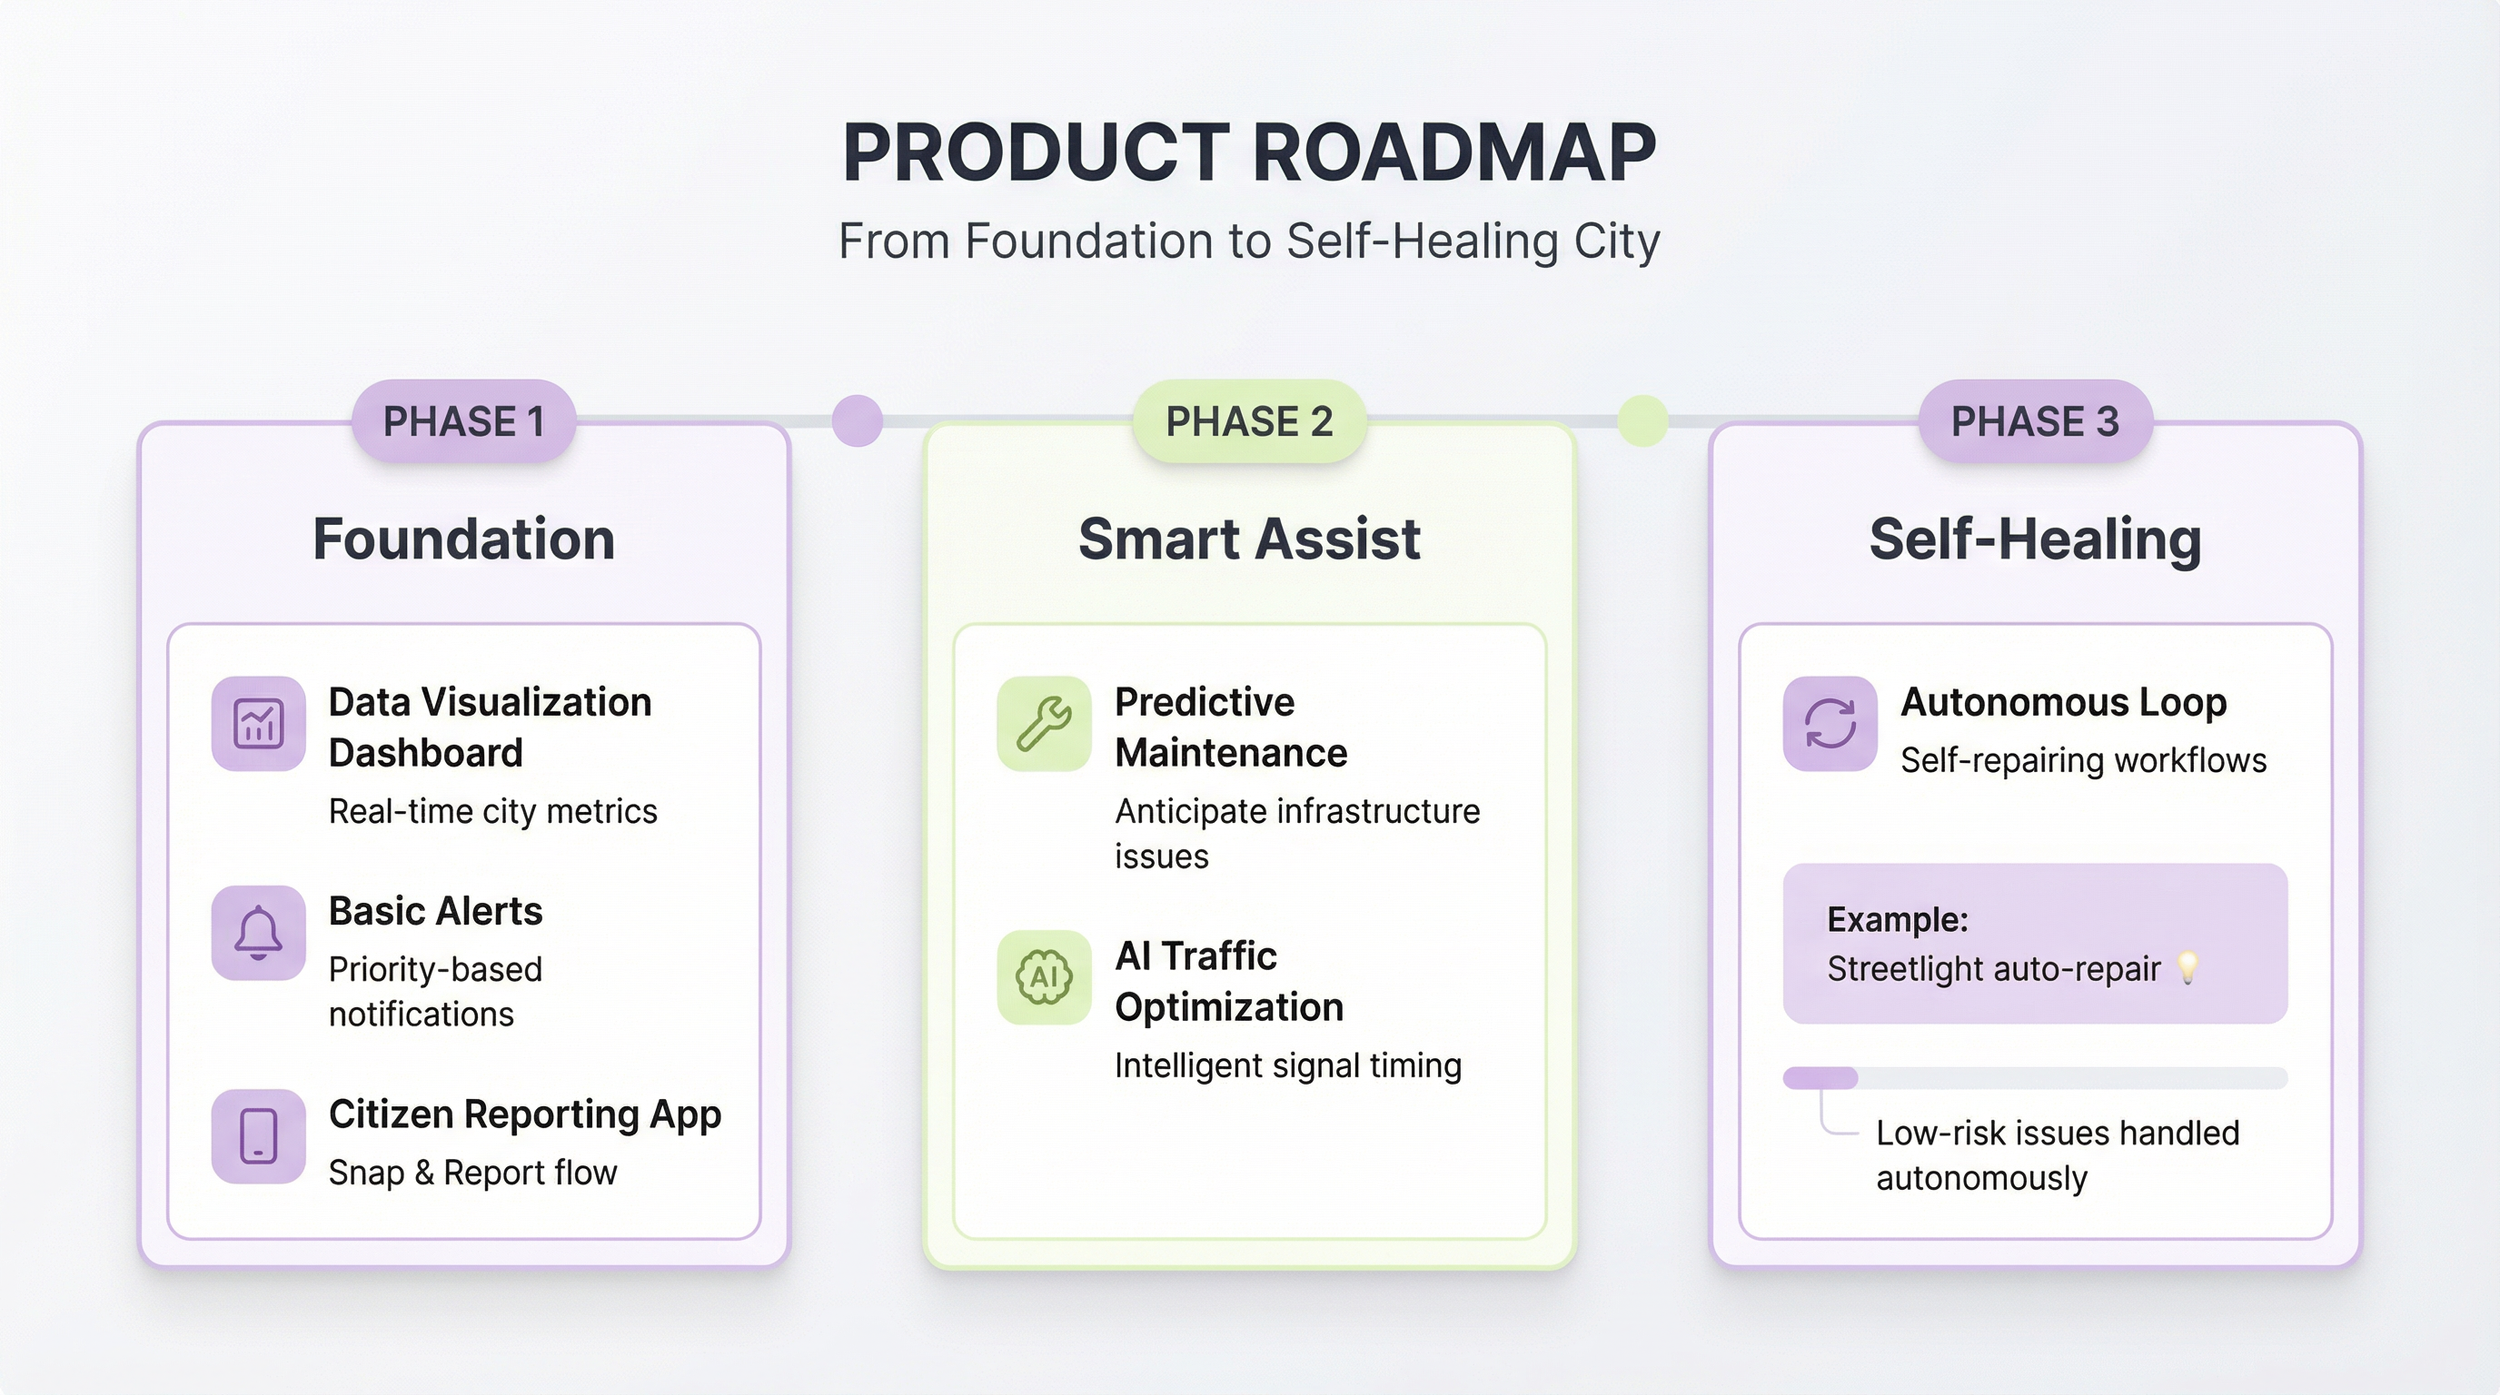
6.3 Product Roadmap
-
Data Visualization Dashboard + Basic Alerts + Citizen Reporting App.
-
Predictive Maintenance + AI Traffic Optimization.
-
Autonomous Loop (Self-repairing workflows for low-risk issues like streetlights).
7.0 Conclusion
The final section consolidates research, strategy, and design outcomes, providing a comprehensive view of how the City OS framework translates into coherent product experiences and demonstrable impact.